


Market Summary
The rout in the stock market that began around at the end of last year took a turn for the worse early this month. By Feb. 10 the Standard & Poor's 500-stock index was down 9% for the year. This is the worst start since the recession year of 2008. The stock market ended a five-day losing streak Friday as financial, commodity-related and other beaten-down shares rebounded. The week still ended lower as the S&P 500 touching a two-year low on Thursday, and all three indexes still posted losses for the week with the S&P 500 Index dropping 0.8% while the Blue Chip-heavy Dow Jones Industrial Average's fell 1.4%. The Nasdaq crashed 0.6% last week while the small cap Russell 2000 slumped 1.38%. As seen in the chart below, investors continue to protect themselves with "risk off" trading as they continue to bid on safe-haven assets like Treasuries and Gold. And what a difference a year makes, as last year gold stocks mired in a bear market, as evidenced in the chart below gold shares have started this year off in the stratosphere.

Put/Call Ratio is the ratio of trading volume of put options to call options. The Put/Call Ratio has long been viewed as an indicator of investor sentiment in the markets. Times where the number of traded call options outpaces the number of traded put options would signal a bullish sentiment, and vice versa. Technical traders have used the Put/Call Ratio for years as an indicator of the market. Most importantly, changes or swings in the ratio are seen as instances of great importance as this is commonly viewed as a change in the tide of overall market sentiment. Normally the Put/Call ratio is extremely bearish during a market downtrend. However the current ratio is moderately bullish. This might be because investors are buying call contracts to hedge their bets on recovery bounce instead of using more money to take long positions.

A standard chart that we use to help confirm the overall market trend is the Momentum Factor ETF (MTUM) chart. Momentum Factor ETF is an investment that seeks to track the investment results of an index composed of U.S. large- and mid-capitalization stocks exhibiting relatively higher price momentum. This type of momentum fund is considered a reliable proxy for the general stock market trend. We prefer to use the Heikin-Ashi format to display the Momentum Factor ETF. Heikin-Ashi candlestick charts are designed to filter out volatility in an effort to better capture the true trend. Last week's analysis came to fruition "...the stock market is setting up for a "dead cat" bounce...MTUM has converted to a firm downtrend...momentum changing to bearish, which suggests stock prices should remain suppressed near term..." A few ago we reported "...MTUM has converted from a long-term uptrend into trading range established last summer. As long as it remains within the range it is reasonable to expect a near-term recovery bounce..." The updated weekly chart below shows significant structural damage as the MTUM closed below the bottom of the trading range. Also highlighted is strong negative momentum, which suggests the market is probably in for a lot more pain.

In the chart below, the Aggregate Bond ETF (AGG) represents the "bond" market and the Equal-Weight S&P 500 ETF (RSP) is the stock market benchmark. The updated chart below continues to show that as investors sell off equites they are depositing the proceeds into the bond market.

As seen in the chart below the dollar posted its second straight weekly decline against major rivals against the backdrop of panicky global stock markets, and doubt that the Federal Reserve will raise rates any time soon. The dollar has been weakening as market turmoil has led global investors to the perceived safe-havens like the gold and U.S. Treasuries. Janet Yellen's testimony on Capitol Hill last week also cast doubt on the likelihood that the central bank will raise rates when they next meet in March or during the rest of the year. Treasury prices climbed last week as investors sold stocks and continued investing in safe-haven assets, namely government bonds and gold, amid a global rout in equities and oil. Gold jumped almost 6% on Friday, the highest level since February 2015, and the gain was the biggest intraday advance since 2009.

Market Outlook
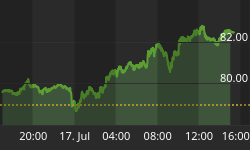
The S&P 500 is down about 13% from its record high in May, as oil remains in a deep slump, while concerns about stability among banks and uncertainty about the U.S. Federal Reserve's path of rate hikes have pushed investors away from risk assets. As reported in the Stock Trader's Almanac, since every bear market in history began as a correction, a bear market remains on the table. To officially end the current cycle the S&P 500 would need to eclipse its previous high which is also still a possibility no matter how unlikely it may seem. In the near-term a lot of market pundits expect market volatility to remain elevated as the market wrestles with economic data and Fed actions. Fundamentals are still mixed and the technical picture is bleak, but DJIA, S&P 500 and NASDAQ have not all violated their respective October 2014 lows. As we have been saying the past few weeks "...investors trading "risk off" since the start of the year, as the only profitable asset classes are bonds and gold..." Gold has climbed 18% this year, making it the best-performing commodity. The outlook for U.S. interest rates to stay low has boosted gold's appeal because it doesn't pay interest like some other assets and investors are piling into gold funds at the fastest pace in seven years.

The CBOE Volatility Index (VIX) is known as the market's "fear gauge" because it tracks the expected volatility priced into short-term S&P 500 Index options. When stocks stumble, the uptick in volatility and the demand for index put options tends to drive up the price of options premiums and sends VIX higher Last week we said, "...fear reemerged last week. Investors got nervous and sold off stocks which sent the Volatility Index 7.1% higher..." The orange line in the updated weekly chart below show the Volatility Index remains near the elevated level where the stock market usually stumbles. If the VIX ever closes above this line it would signal the S&P is might be headed toward multiyear lows.

The American Association of Individual Investors (AAII) Sentiment Survey measures the percentage of individual investors who are bullish, bearish, and neutral on the stock market for the next six months; individuals are polled from the ranks of the AAII membership on a weekly basis. The current survey result is for the week ending 02/10/2016. The most recent AAII survey showed 19.20% are Bullish and 48.70% Bearish, while 32.10% of investors polled have a Neutral outlook for the market for the next six months. The current AAII survey bearish percentage is the highest since 2009 and the bullish number is near historical lows. Normally the AAII Sentiment Survey is a reliable contra indicator, but the current extreme numbers confirm that retail investors are content to sit on the sidelines until the stock market shows sign of a bottom.

The Nation Association of Active Investment Managers (NAAIM) Exposure Index represents the average exposure to US Equity markets reported by NAAIM members. The blue bars depict a two-week moving average of the NAAIM managers' responses. As the name indicates, the NAAIM Exposure Index provides insight into the actual adjustments active risk managers have made to client accounts over the past two weeks. The current survey result is for the week ending 02/10/2016. Fourth-quarter NAAIM exposure index averaged 44.61%. Last week the NAAIM exposure index was 22.41%, and the current week's exposure is 32.87%. The NAAIM exposure index remains near historical lows while the stock market is in confirmed downtrend approaching bear market territory.

Trading Strategy
As we have been saying for the past few weeks "...the only positive S&P sector so far this year are Utility stocks. The biggest risk to investors is chasing stock prices higher as the market continues a counter-trend bounce, then stocks abruptly sell-off to resume the downtrend catching everyone by surprise - this is known as a "bear trap"... The bear trap was setup and it captured unsuspecting investors as the market reversed course and ended the week lower. Many stocks that had led on the way up in 2015 are now leading the way down...In a bear market make sure you keep tight stops in play, especially on the long side..." impatient investors have gotten accustomed to selling stocks whenever oil dips. With oil in serious oversupply, it's hard to sustain any kind of recovery on Wall Street. "The toughest problem for people to deal with is oil getting linked with the market," says Tobias Levkovich, Citigroup's chief U.S. equity strategist. Over the past 30 days Utility Sector stocks continued to significantly outperform the rest of the market and remain the only viable equity group. Financials have been the weakest-performing sector this year. Recession fears have compounded concern about their exposure to the energy sector and expectations that global interest rates are unlikely to rise quickly.

Feel free to contact me with questions,


