


USDCHF
On the intraday chart of USDCHF we are tracking an extended wave 3 that seems to be near completion, as the last blue wave v is already in motion with visible five subwaves up from 0.9848. That said traders must be aware of a corrective set-back in the near-term; possibly even back to levels around 0.9900 or even 0.9848, support of a former wave four.
USDCHF, 4H

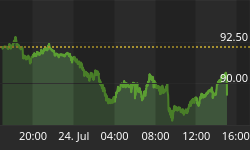
EURJPY
EURJPY moved down as expected from our correction in blue wave two, and can now ideally continue towards our 138.2 fibo. ratio. Notice that on the hourly chart we are tracking an extended blue wave three which may break beneath 125.79 soon, but from a larger point of view we think that 125.00 can be seen in sessions ahead while price trades beneath 127.15.
EURJPY, 4H

If you like our trading analysis, you can visit our website at --> www.ew-forecast.com


