Improving ... but the hurdles are not gone yet.
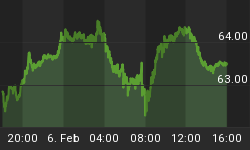
What are we describing? The level of Inflowing Liquidity coming into the stock market. If you look at today's chart of Inflowing Liquidity levels, you will see that there was a small down tick on Friday while Thursday's up tick was a higher/high. Although struggling, this describes up trending.
Note that the thick red lines on the chart. They trace out a triangular pattern where the triangle's upside resistance is fast approaching.


