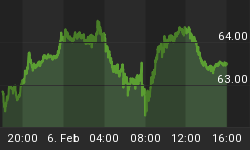
To sum up my view of this week's COT report in one word.... WORRISOME.
I use that word because of what we saw happen to the safe haven trades today on account of that monster rally in the US equity markets.
Gold was under pressure for the entirety of the session today but seemed to especially weaken into the late afternoon hours as the US equity markets kept pushing higher and went out near the highs of the day. That more than likely will translate into additional downside followthrough in Asian trade Sunday evening. Where it goes after that will depend on whether or not dip buyers show up.
Let me show you why I am concerned.
First of all, on this TWO HOUR CHART, you can see that there was a huge spike in volume last Friday during which gold ran to $1280. Recall that was the day that the payrolls data was released. Yesterday, the day of the announcement by the ECB of additional stimulus measures to be implemented, gold spiked higher but then faded. Notice that the volume was lower. That is a warning that bulls should not ignore.
Now, as long as the lower two support lines hold firm, there is no need for concern. If those lines give way and if price does not recover above them right away, there is the real danger of some significant long side liquidation occurring. Why? Look at this chart of the hedge fund outright positions, both shorts and longs.
This is the highest number of longs that they have carried in thirteen months.
Over against this is the following chart.
This is the largest net short position of the Swap Dealers in the same thirteen months while the Commercials have the largest net short position in 37 months.
On a percentage basis, the combined short positions of the Commercials and the Swap Dealers remain near levels commensurate with interim tops. Also, the combined long position of the large specs is also quite elevated.
This is important - I have not been as concerned about these high levels of spec longs in the market as I would normally been otherwise for the one reason that the reported holdings in GLD have steadily increased during the entire time this imbalance has existed. That development has been a signal that gold demand in the West remains rock solid.
As long as this GLD does not falter, specs will hang tough on the long side. If however, they were to see any faltering of demand, as evidenced by a fall in the reported holdings, plus a downturn in the HUI/Gold ratio, we could see some nervous longs head for the exits.
We'll see what we get Sunday evening but unless there is something that changes over the weekend, I expect to see gold open weaker Sunday evening here in the West. Much will depend on whether or not sentiment towards risk remains like it did today (Friday).


