• 909 days Will The ECB Continue To Hike Rates?
  • 909 days Forbes: Aramco Remains Largest Company In The Middle East
  • 911 days Caltech Scientists Succesfully Beam Back Solar Power From Space
  • 1,310 days Could Crypto Overtake Traditional Investment?
  • 1,315 days Americans Still Quitting Jobs At Record Pace
  • 1,317 days FinTech Startups Tapping VC Money for ‘Immigrant Banking’
  • 1,320 days Is The Dollar Too Strong?
  • 1,321 days Big Tech Disappoints Investors on Earnings Calls
  • 1,321 days Fear And Celebration On Twitter as Musk Takes The Reins
  • 1,323 days China Is Quietly Trying To Distance Itself From Russia
  • 1,323 days Tech and Internet Giants’ Earnings In Focus After Netflix’s Stinker
  • 1,327 days Crypto Investors Won Big In 2021
  • 1,328 days The ‘Metaverse’ Economy Could be Worth $13 Trillion By 2030
  • 1,328 days Food Prices Are Skyrocketing As Putin’s War Persists
  • 1,331 days Pentagon Resignations Illustrate Our ‘Commercial’ Defense Dilemma
  • 1,331 days US Banks Shrug off Nearly $15 Billion In Russian Write-Offs
  • 1,334 days Cannabis Stocks in Holding Pattern Despite Positive Momentum
  • 1,335 days Is Musk A Bastion Of Free Speech Or Will His Absolutist Stance Backfire?
  • 1,335 days Two ETFs That Could Hedge Against Extreme Market Volatility
  • 1,337 days Are NFTs About To Take Over Gaming?
  1. Home
  2. Markets
  3. Other

Elliott Wave Analysis On German DAX And Crude Oil

German DAX

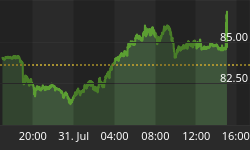
On the intraday chart of German DAX, we are observing an idea of a zig-zag pattern in red wave B), that started from wave A) lows at 9392.2 and could already be near completion, as three legs to the upside have already unfold. That said broken lower channel line can suggest more weakness in seasons ahead, ideally towards 9536-9606 area, where recent gap can be filled.

German DAX, 1H

German DAX 1-Hour Chart


Crude Oil

As of recent completed five wave rally from wave iv-circled lows towards 42.47 level, we believe that price is now trading in a correction, ideally in wave b)/ii) that can reverse around 42.00-42.15 area, into wave c)/iii). That said invalidation level is at 42.47-as long as it holds, the count is valid.

Crude OIL, 1H

Crude Oil 1-Hour Chart


If you like our trading analysis, you can visit our website at --> www.ew-forecast.com


Back to homepage

Leave a comment

Leave a comment