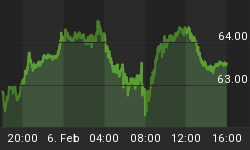
The price of gold moved down slightly this week, while that of silver dropped more substantially -- 1.9%. We don't see much decrease in the enthusiasm yet from this minor setback.
This was a shortened week due to the May Day holiday outside the US.
Let's look at the only true picture of supply and demand fundamentals. But first, here's the graph of the metals' prices.
The Prices of Gold and Silver

Next, this is a graph of the gold price measured in silver, otherwise known as the gold to silver ratio. The ratio was up over a point this week.
The Ratio of the Gold Price to the Silver Price

For each metal, we will look at a graph of the basis and cobasis overlaid with the price of the dollar in terms of the respective metal. It will make it easier to provide brief commentary. The dollar will be represented in green, the basis in blue and cobasis in red.
Here is the gold graph.
The Gold Basis and Cobasis and the Dollar Price

We had to expand the range of the basis axis. The basis ended the week up, and cobasis ended down. However, those spikes on Wednesday are really remarkable. It may just be a one-off event (though even that raises some questions about liquidity).
Our calculated fundamental price is up a few dollars, but it's still more than $40 below the market price.
We just are not seeing the driver of a bull market in gold. Does that mean the price couldn't rise further, driven by speculative greed? No, of course not. It just means that the supply and demand fundamentals are weak, as weak as we have seen them in years.
As recently as the first week of March, gold was selling at a $200 discount to its fundamental. Supply and demand conditions have eroded, and recently the market price has risen above this lower fundamental.
Now let's turn to silver.
The Silver Basis and Cobasis and the Dollar Price

In silver, the price is down and the abundance (blue line) is down.
It does seem a bit anomalous that silver is showing relatively less weak fundamentals than gold. We shall see if this trend has legs.
Unsurprisingly, the fundamental price of silver went up. It's now only $1.50 below the market price.
The fundamental gold-silver ratio is 78.


