• 723 days Will The ECB Continue To Hike Rates?
  • 723 days Forbes: Aramco Remains Largest Company In The Middle East
  • 725 days Caltech Scientists Succesfully Beam Back Solar Power From Space
  • 1,125 days Could Crypto Overtake Traditional Investment?
  • 1,130 days Americans Still Quitting Jobs At Record Pace
  • 1,132 days FinTech Startups Tapping VC Money for ‘Immigrant Banking’
  • 1,135 days Is The Dollar Too Strong?
  • 1,135 days Big Tech Disappoints Investors on Earnings Calls
  • 1,136 days Fear And Celebration On Twitter as Musk Takes The Reins
  • 1,138 days China Is Quietly Trying To Distance Itself From Russia
  • 1,138 days Tech and Internet Giants’ Earnings In Focus After Netflix’s Stinker
  • 1,142 days Crypto Investors Won Big In 2021
  • 1,142 days The ‘Metaverse’ Economy Could be Worth $13 Trillion By 2030
  • 1,143 days Food Prices Are Skyrocketing As Putin’s War Persists
  • 1,145 days Pentagon Resignations Illustrate Our ‘Commercial’ Defense Dilemma
  • 1,146 days US Banks Shrug off Nearly $15 Billion In Russian Write-Offs
  • 1,149 days Cannabis Stocks in Holding Pattern Despite Positive Momentum
  • 1,150 days Is Musk A Bastion Of Free Speech Or Will His Absolutist Stance Backfire?
  • 1,150 days Two ETFs That Could Hedge Against Extreme Market Volatility
  • 1,152 days Are NFTs About To Take Over Gaming?
Another Retail Giant Bites The Dust

Another Retail Giant Bites The Dust

Forever 21 filed for Chapter…

Is The Bull Market On Its Last Legs?

Is The Bull Market On Its Last Legs?

This aging bull market may…

  1. Home
  2. Markets
  3. Other

Elliott Wave Analysis On SP500 And GOLD

S&P500

E-mini S&P500 has five waves up from the low after we identified an ending diagonal last week that now obviously appears finished at 2030. As such, we can expect more gains after any three wave retracement that can already be in the cards now back to 2040-2045 area where we will look for a new bounce, above 2060 while market trades above 2030 invalidation point.

S&P500, 30 Min

S&P500 30-Minute Chart


GOLD

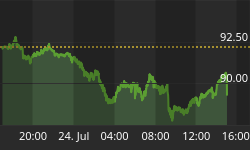
Gold is bearish the last seven days, but for now still only with three waves so decline from 1303 can be temporary. An updated wave count shows that price is now weakening within wave C headed down to around 1263 where we see 100% Fibonacci level that can react as a support. Only bounce from there with five waves back to 1290 would be bullish evidence for a new turn back to the highs.

GOLD, 1H

Gold 1-Hour Chart


Are you also wondering where is the S&P500 headed long-term, or GOLD or Forex pairs? We have special updates for active traders. For more details, visit our page at www.ew-forecast.com


Back to homepage

Leave a comment

Leave a comment