• 395 days Could Crypto Overtake Traditional Investment?
  • 400 days Americans Still Quitting Jobs At Record Pace
  • 402 days FinTech Startups Tapping VC Money for ‘Immigrant Banking’
  • 405 days Is The Dollar Too Strong?
  • 405 days Big Tech Disappoints Investors on Earnings Calls
  • 406 days Fear And Celebration On Twitter as Musk Takes The Reins
  • 408 days China Is Quietly Trying To Distance Itself From Russia
  • 408 days Tech and Internet Giants’ Earnings In Focus After Netflix’s Stinker
  • 412 days Crypto Investors Won Big In 2021
  • 412 days The ‘Metaverse’ Economy Could be Worth $13 Trillion By 2030
  • 413 days Food Prices Are Skyrocketing As Putin’s War Persists
  • 415 days Pentagon Resignations Illustrate Our ‘Commercial’ Defense Dilemma
  • 416 days US Banks Shrug off Nearly $15 Billion In Russian Write-Offs
  • 419 days Cannabis Stocks in Holding Pattern Despite Positive Momentum
  • 420 days Is Musk A Bastion Of Free Speech Or Will His Absolutist Stance Backfire?
  • 420 days Two ETFs That Could Hedge Against Extreme Market Volatility
  • 422 days Are NFTs About To Take Over Gaming?
  • 423 days Europe’s Economy Is On The Brink As Putin’s War Escalates
  • 426 days What’s Causing Inflation In The United States?
  • 427 days Intel Joins Russian Exodus as Chip Shortage Digs In
Another Retail Giant Bites The Dust

Another Retail Giant Bites The Dust

Forever 21 filed for Chapter…

Zombie Foreclosures On The Rise In The U.S.

Zombie Foreclosures On The Rise In The U.S.

During the quarter there were…

  1. Home
  2. Markets
  3. Other

Elliott Wave Analysis On GBPAUD And CADJPY

GBPAUD

GBPAUD is trading in an impulsive structure from the lows. Current count is displaying three waves to the upside with a corrective pullback in wave 4) with possible support seen at 2.002 region, where previous wave 4 can act as a turning point higher.

GBPAUD, 4H

GBP/AUD 4-Hour Chart


CADJPY

CADJPY seems to be in a corrective pullback pattern labeled as blue waves A-B and C, with a possibility of reaching lower levels ,after and if the lower connecting channel line is breached. As of now we recognized the first impulsive drop from the end of wave C as blue wave 1 and now we expect a zig-zag to unfold in blue wave 2, ideally to around 50 or 61.8%, before more downside may follow.
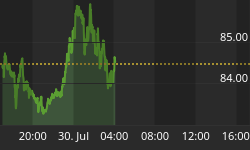
CADJPY, Daily

CAD/JPY Daily Chart


Interested in our services ? We have a Special Offer : Get First 2 Months For The Price Of 1!! Grab the opportunity now at www.ew-forecast.com


Back to homepage

Leave a comment

Leave a comment