• 618 days Will The ECB Continue To Hike Rates?
  • 619 days Forbes: Aramco Remains Largest Company In The Middle East
  • 620 days Caltech Scientists Succesfully Beam Back Solar Power From Space
  • 1,020 days Could Crypto Overtake Traditional Investment?
  • 1,025 days Americans Still Quitting Jobs At Record Pace
  • 1,027 days FinTech Startups Tapping VC Money for ‘Immigrant Banking’
  • 1,030 days Is The Dollar Too Strong?
  • 1,030 days Big Tech Disappoints Investors on Earnings Calls
  • 1,031 days Fear And Celebration On Twitter as Musk Takes The Reins
  • 1,033 days China Is Quietly Trying To Distance Itself From Russia
  • 1,033 days Tech and Internet Giants’ Earnings In Focus After Netflix’s Stinker
  • 1,037 days Crypto Investors Won Big In 2021
  • 1,037 days The ‘Metaverse’ Economy Could be Worth $13 Trillion By 2030
  • 1,038 days Food Prices Are Skyrocketing As Putin’s War Persists
  • 1,040 days Pentagon Resignations Illustrate Our ‘Commercial’ Defense Dilemma
  • 1,041 days US Banks Shrug off Nearly $15 Billion In Russian Write-Offs
  • 1,044 days Cannabis Stocks in Holding Pattern Despite Positive Momentum
  • 1,045 days Is Musk A Bastion Of Free Speech Or Will His Absolutist Stance Backfire?
  • 1,045 days Two ETFs That Could Hedge Against Extreme Market Volatility
  • 1,047 days Are NFTs About To Take Over Gaming?
Trade In Counterfeit Goods Hits Half A Trillion Dollars

Trade In Counterfeit Goods Hits Half A Trillion Dollars

The counterfeit market has breached…

How Millennials Are Reshaping Real Estate

How Millennials Are Reshaping Real Estate

The real estate market is…

  1. Home
  2. Markets
  3. Other

Elliott Wave Analysis On 10-Year US Notes And SP500

10-Year US Notes

After completing a three wave correction in B wave, Wave C now seems to be almost finished, as four sub-waves could already be viewed on the intraday chart. As we know wave C is an impulsive wave, which consist out of five sub-waves. Three of them, wave 1, 3 and 5 are impulsive, while the other two : 2 and 4 are corrective, with each having three more sub-waves.

As on this chart, we now believe that after wave iii is completed a minimum three wave correction may follow in wave iv, thus meaning that price may slow down a bit, before again searching for a new high in blue wave v.

10-Year US Notes, 4H

10-Year US Notes 4-Hour Chart


S&P500

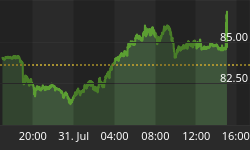
On the intraday chart of S&P500 we are observing an idea of a completed flat correction that took place in the blue wave iv. A flat correction is a contra-trend movement, that consist of waves A-B-C with a 3-3-5 structure. As of recent bounce higher, we believe that correction may be over and that last leg v can be underway towards higher levels, ideally reaching 2018 levels.

S&P500, 1H

S&P500 1-Hour Chart


Interested in our services ? We have a Special Offer: Get First 2 Months For The Price Of 1!! Grab the opportunity now at www.ew-forecast.com


Back to homepage

Leave a comment

Leave a comment