• 820 days Will The ECB Continue To Hike Rates?
  • 820 days Forbes: Aramco Remains Largest Company In The Middle East
  • 822 days Caltech Scientists Succesfully Beam Back Solar Power From Space
  • 1,222 days Could Crypto Overtake Traditional Investment?
  • 1,227 days Americans Still Quitting Jobs At Record Pace
  • 1,229 days FinTech Startups Tapping VC Money for ‘Immigrant Banking’
  • 1,232 days Is The Dollar Too Strong?
  • 1,232 days Big Tech Disappoints Investors on Earnings Calls
  • 1,233 days Fear And Celebration On Twitter as Musk Takes The Reins
  • 1,235 days China Is Quietly Trying To Distance Itself From Russia
  • 1,235 days Tech and Internet Giants’ Earnings In Focus After Netflix’s Stinker
  • 1,239 days Crypto Investors Won Big In 2021
  • 1,239 days The ‘Metaverse’ Economy Could be Worth $13 Trillion By 2030
  • 1,240 days Food Prices Are Skyrocketing As Putin’s War Persists
  • 1,242 days Pentagon Resignations Illustrate Our ‘Commercial’ Defense Dilemma
  • 1,243 days US Banks Shrug off Nearly $15 Billion In Russian Write-Offs
  • 1,246 days Cannabis Stocks in Holding Pattern Despite Positive Momentum
  • 1,247 days Is Musk A Bastion Of Free Speech Or Will His Absolutist Stance Backfire?
  • 1,247 days Two ETFs That Could Hedge Against Extreme Market Volatility
  • 1,249 days Are NFTs About To Take Over Gaming?
How The Ultra-Wealthy Are Using Art To Dodge Taxes

How The Ultra-Wealthy Are Using Art To Dodge Taxes

More freeports open around the…

Another Retail Giant Bites The Dust

Another Retail Giant Bites The Dust

Forever 21 filed for Chapter…

What's Behind The Global EV Sales Slowdown?

What's Behind The Global EV Sales Slowdown?

An economic slowdown in many…

  1. Home
  2. Markets
  3. Other

Elliott Wave Analysis On SP500 And EURJPY

S&P500

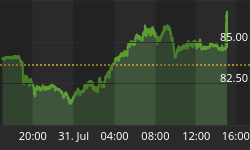
On the intraday chart of S&P500, we are observing wave v, the final wave of an impulsive structure, which can indicate a contratrend movement, after its completion. As of now, we can see that price made a nice slow reversal, possibly resulting as wave a, the first wave of a minum three wave drop.

Recently broken corrective channel line, could indicate lower levels, and a possible suppert can now be seen around the previos zone of the formal wave iv.

S&P500, 1H

S&P500 1-Hour Chart


EURJPY

On the EURJPY chart, we see current sideways price action as a possible triangle and temporary consolidation before lower levels could be seen. After we break this triangle we expect to trace one more wave to the downside to complete red wave 3 at 120.00-20 levels.

EURJPY, 30 Min

EUR/JPY 30-Minute Chart


Interested in our services ? We have a Special Offer : Get First 2 Months For The Price Of 1!! Grab the opportunity now at www.ew-forecast.com


Back to homepage

Leave a comment

Leave a comment