


The gold mining stocks continue to defy any bearish price action or perceived bearish development. Pundits first warned because of the “bearish” CoT data. The commercials are always right and a big decline is coming! Then we heard the miners were too overbought and would have to correct 20%. (I thought this once or twice!) Next we heard Gold was forming a head and shoulders top. Conventional analysis is failing in trying to predict or even explain what is happening and why. A look at history helps explain why the gold mining sector has remained extremely strong and almost immune to any sustained correction. Simply put, history shows that epic bears give birth to bull markets that in their first year do not experience any significant correction or retracement.
The Nasdaq, which is comprised of mostly tech stocks crashed 78% during its bear market from 2000 to 2002. That epic bear followed a full blown mania and a strong recovery followed that epic collapse. The Nasdaq rebounded by 94% in 15 months and only endured one significant correction during the recovery. That 17% correction occurred while the market was in a bottoming process. Once the Nasdaq exceeded 1400 it enjoyed smooth sailing to 2100 over the next nine months.

The next chart plots the S&P 500 and the Nasdaq from 2008 to 2011. The bear market in price terms was the worst for the S&P 500 since World War II. Its recovery was equally as spectacular as the index gained 83% in 13 months without correcting more than 9%. During the same period, the Nasdaq doubled and did not shed more than 10%!

Speaking of World War II, it kicked off the best buying opportunity of all time as the stock market enjoyed fabulous returns over the next year, three years, five years, 10 years and 15 years. The stock market declined 60% over the previous five years. It was the longest bear market in modern times and the second worst in terms of price. During the ensuing recovery, the S&P 500 gained 70% in 14 months and did not correct more than 5%! It also held above its 50-day moving average nearly the entire time!

While the gold mining space is a very tiny sector and its own animal compared to the stock market, its current recovery can be accurately depicted in a strikingly similar context. The recovery has been extremely strong in terms of price and the lack of declines. The gold stock indices are up over 100% and have yet to correct even 20%! It makes perfect sense considering gold stocks are following their worst bear market ever and in January were perhaps at their own 1942 moment.
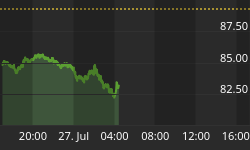
The gold stocks are following a history that suggests potentially another six to nine months of steady gains without a major correction or retracement. In looking at both the gold stocks and Gold (chart below), we can see potential six to nine month upside targets of HUI 365 and Gold $1500-$1550. The HUI has overhead resistance to overcome while Gold has $1300 and $1400 to overcome.

We've said it before and we will say it again. It is hard to be bullish when something is so overbought and trading so much higher than in recent months. However, the one time to be bullish amid that context is when the market at hand has emerged from a brutal bear market. The gold mining sector is only five months into this new bull market. The historical pattern that gold stocks are currently following suggests potentially another six to nine months of upside before a major correction or retracement. It is difficult to be bullish or be a buyer here but our research suggests it is the correct posture. As we noted last week, +10% weakness could be a good buying opportunity.
Consider learning more about our premium service including our favorite junior miners which we expect to outperform in the second half of 2016<. href="http://thedailygold.com/premium/">


