


Market Summary
U.S. stocks finished out the week lower, as investors continued to fret over the possibility that the U.K. may leave the European Union on top of lingering concerns about the Federal Reserve's reluctance to raise interest rates. Despite the end of the week sell-off, U.S. equities managed to ward off a major slide due to early week strength in the stock market. Next week could be interesting due to the Brexit vote and scheduled comments from Fed Chairperson Janet Yellen. For the week, the S&P 500 Index finished flat and the Blue Chip-heavy Dow Jones Industrial Average slid 1.1%. The Nasdaq finished the week down .9% and while the small cap Russell 2000 fell .5%.

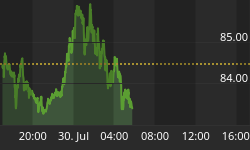
A standard chart that we use to help confirm the overall market trend is the Momentum Factor ETF (MTUM) chart. Momentum Factor ETF is an investment that seeks to track the investment results of an index composed of U.S. large- and mid-capitalization stocks exhibiting relatively higher price momentum. This type of momentum fund is considered a reliable proxy for the general stock market trend. We prefer to use the Heikin-Ashi format to display the Momentum Factor ETF. Heikin-Ashi candlestick charts are designed to filter out volatility in an effort to better capture the true trend. The updated chart below supports the contention that the market is due for a pause or even a pullback. The orange circles denote overbought levels where the market usually stalls out. Also highlighted is how the recent uptrend has been broken, which backs the analysis suggesting stalling prices.

In the chart below the dollar fell last week after investors dialed back their expectations for an early rate increase by the Federal Reserve. Gold prices gained about 1.5% for the week to log their third-straight weekly advance. Safe-haven assets, such as gold, have enjoyed a strong rally recently after polls indicated a shift in sentiment in the U.K. in favor of a Brexit vote. On Thursday, the precious metal settled at its highest level since January 2015 after two fresh surveys showed increased support for those who want to "leave" the EU. Treasury prices rose for third week in a row as Brexit vote looms. Over the past several weeks' investors flocked to safe assets such as government bonds, depressing their yields, when polls pointed to higher odds of Britain leaving.

Market Outlook
A lot of individual investors are concerned about the slow pace of U.S. economic growth and uncertain pace of global economic growth, terrorism and global unrest, lackluster corporate earnings, the prevailing level of valuations, the forthcoming November elections and monetary policy. Conversely, sustained domestic economic growth, corporate earnings and the proximity of stock prices to their record highs encourage some market watchers. In the chart below "risk-off" asset classes that benefit from low interest rates are far and away the top performers for the second quarter. Uncertainty about the Fed and Brexit will cap upside movement until there is clarity on both," said Uri Landesman, president of Platinum Partners. Investors are nervous so the market is likely to remain depressed for now, he added.

The CBOE Volatility Index (VIX) is known as the market's "fear gauge" because it tracks the expected volatility priced into short-term S&P 500 Index options. When stocks stumble, the uptick in volatility and the demand for index put options tends to drive up the price of options premiums and sends the VIX higher. The chart below confirms how option volatility exploded a few weeks ago as we opined "...The ‘Fear Gauge' was at oversold levels so the massive percentage jump is not surprising. We may see some additional Risk-buying into the Fed announcement on Wednesday..." You can see how this analysis played out as advertised with the VIX rising to the highest level since the February market crash.

The American Association of Individual Investors (AAII) Sentiment Survey measures the percentage of individual investors who are bullish, bearish, and neutral on the stock market for the next six months; individuals are polled from the ranks of the AAII membership on a weekly basis. The current survey result is for the week ending 06/15/2016. Bearish sentiment rose to its highest level and neutral sentiment fell to its lowest level since February. Even with the big jump, pessimism remains within its typical historical range and optimism remains at an unusually low level. Bullish sentiment, expectations that stock prices will rise over the next six months, declined 2.5 percentage points to 25.3%. This is the seventh time in the past eight weeks that fewer than three out of 10 survey respondents are optimistic. It is also the 32nd consecutive week and the 65th out of the past 67 weeks with bullish sentiment below its historical average of 38.5%. Neutral sentiment, expectations that stock prices will stay essentially unchanged over the next six months, plunged 7.2 percentage points to 37.2%. Neutral sentiment was last lower on February 17th (34.6%). Even with the big drop, neutral sentiment is above its historical average of 31.0% for the 20th consecutive week. Bearish sentiment, expectations that stock prices will fall over the next six months, surged 9.7 percentage points to 37.5. The big jump put bearish sentiment above its historical average of 30.5% for just the third time in the 16 weeks. The big jump in pessimism occurred as the major U.S. indexes pulled back from their recent highs. Many AAII members have previously expressed concerns about valuations and/or a potential drop in stock prices occurring.

The National Association of Active Investment Managers (NAAIM) Exposure Index represents the average exposure to US Equity markets reported by NAAIM members. The blue bars depict a two-week moving average of the NAAIM managers' responses. As the name indicates, the NAAIM Exposure Index provides insight into the actual adjustments active risk managers have made to client accounts over the past two weeks. The current survey result is for the week ending 06/15/2016. First-quarter NAAIM exposure index averaged 45.89%. Last week the NAAIM exposure index was 74.80%, and the current week's exposure is 75.96%. Last week's comments came to fruition where we said "...Professional money managers appear to be anticipating dovish comments from the FOMC meeting next week and are increasing equity exposure..." The Fed confirmed a dovish position as professional investors buy equities ahead of quarterly earnings in a few weeks.

Trading Strategy
An article published in MarketWatch.com reported on how the long-anticipated "Brexit" referendum on the U.K.'s membership in the European Union is set for Thursday. Polls released in recent weeks showed gathering support for the "leave" vote -- an outcome that many economists say would spark widespread turmoil in global markets and possibly sink the U.K. into a recession. Last week we discussed how the Stock Trader's Almanac talked about how "... the week after Triple-Witching Day is horrendous. This week has experienced DJIA losses in 23 of the last 26 years with average losses of 1.1%. S&P 500 and NASDAQ have fared slightly better during the week after over the same 25 year span, declining 0.7% and 0.2% respectively on average..." We also said "...If the market does pull back, that might be a good opportunity to "buy the dip" with shares in the leading sectors displayed in the chart below..."

Feel free to contact me with questions,


