


German DAX
US markets are open for trading. DAX is close to reaching our target around 10000, where we believe a five wave move from the lows may come to an end. After black wave 1 is finished, we will be expecting a minimum three waves of a recovery as in a A-B-C manner. As we see price made a gap, an open space on the chart, which means, that this gap will first get filled, before price may again continue higher. That said, we believe that correction in wave 2 may reach levels around 9708/9785 area, before reversing higher.
German DAX, 1H

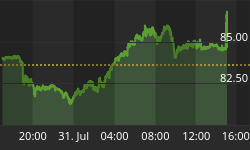
S&P500
S&P500 is as well as Dax showing to be in a pullback mode. Here we have blue waves a and b, that already seem done. We label this count as twofold as there is still a possibility, that price may continue lower thus invalidating recent lows. As of recent price data, we think that price will still continue lower, covering recent gap, and maybe then continue to more weakness, or make a reversal towards new highs.
S&P500, 30Min

Interested in our services ? We have a Special Offer : Get First 2 Months For The Price Of 1!! Grab the opportunity now at www.ew-forecast.com


