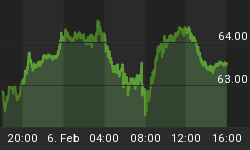
The chart above depicts the movement in the spot price of NYMEX crude oil futures over the past 6 months. Clearly, the price of crude oil has been steadily declining since the double barreled jolts from Mother Nature [Katrina and Rita] rocked the U.S. Gulf Coast. The above picture might lead one to conclude that all is returning to "normal" - whatever that is. Since 'declines' like the one above are often the "fuel" or impetus for retail investors to pitch or liquidate an acquired position - I thought it might be a good time to review the fundamentals on the oil and gas fronts:
For information concerning the storm click on www.mms.gov
| This survey reflects 57 companies' reports as of 11:30 a.m. Central Standard Time. | ||||||
| Districts | Lake Jackson | Lake Charles | Lafayette | Houma | New Orleans | Total |
| Platforms Evacuated | 4 | 44 | 28 | 7 | 51 | 134 |
| Rigs Evacuated | 0 | 0 | 0 | 0 | 1 | 1 |
| Oil, BOPD Shut-In | 1,549 | 47,240 | 132,120 | 71,931 | 362,783 | 615,623 |
| Gas, MMCF/D Shut-In | 211.21 | 703.17 | 717.61 | 427.13 | 1,136.67 | 3,195.78 |
| *These statistics reflect evacuations and shut-in production from Hurricanes Katrina and Rita (remaining)* | ||||||
This chart depicts the extent to which oil and gas production in the U.S. Gulf region is still "shut in" in the aftermath of Katrina and Rita. Perhaps before one considers "pitching" their oil and/or gas investments they might stop to consider the following:
These evacuations are equivalent to 16.36% of 819 manned platforms and 0.75% of 134 rigs currently operating in the Gulf of Mexico (GOM).
Today's shut-in oil production is 615,623 BOPD. This shut-in oil production is equivalent to 41.04% of the daily oil production in the GOM, which is currently approximately 1.5 million BOPD.
Today's shut-in gas production is 3.196 BCFPD. This shut-in gas production is equivalent to 31.96% of the daily gas production in the GOM, which is currently approximately 10 BCFPD.
The cumulative shut-in oil production for the period 8/26/05-11/23/05 is 91,731,141 bbls, which is equivalent to 16.755% of the yearly production of oil in the GOM (approximately 547.5 million barrels).
The cumulative shut-in gas production 8/26/05-11/23/05 is 473.547 BCF, which is equivalent to 12.974% of the yearly production of gas in the GOM (approximately 3.65 TCF).
These cumulative numbers reflect updated production numbers from all previous reports. The reports only represent input received by 11:30 a.m. CST. If a company does not report by 11:30 a.m. it is not included in the special information release, but it is included in the cumulative shut-in production. This may result in an apparent increase in the cumulative report amount.
Shut-ins for oil and gas production are standard procedures conducted by industry for safety reasons. Once facilities have been inspected and all standard checks have been completed the production for these facilities will be brought back on line.
So there you have it folks; a little better than 41% of Gulf Oil Production is still off line along with almost 32% of Gulf Gas Production. So, if any one is caught up in the short term fluctuations of the oil and gas prices as outlined in the chart above - before giving in to the 'itch to pitch' - they might be well served to take a look at this too:
Although much of the winter season will be milder than normal, December and January will be exceptionally cold. Winter-season temperatures will be near normal in Maine, but a degree or two colder than normal elsewhere, on average. Snowfall will be below normal in the northwest, but above normal elsewhere. A big snowstorm will hamper Christmas travel, with other major snowstorms in mid-December and the first half of March.
Temperatures in April and May will be below normal, on average, with above-normal precipitation. Expect snow in early April, and very warm temperatures in early May.
The summer season will be hotter and wetter than normal, although there will not be a prolonged heat wave. The hottest periods will be in mid-July and early and late August.
September and October will be exceptionally mild, with very warm periods in early and mid-September. Rainfall will be near normal in the east and below normal in the west.
You see, from a fundamental standpoint, the ability of the U.S. Gulf Region to produce oil and gas is quite severely curtailed and typically it is temperatures in the North that most heavily influence [heating] demand. A cold winter could very well mean warm returns for your oil and gas investments.
But then again, when does the weather man ever get it right?


