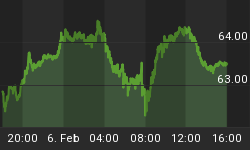
During this past week, the NYA Index made no progress and essentially moved sideways for a week.
What is concerning are the thick red lines on the chart below because there is a negative divergence coming from the MACD for the same periods of time. When looking at the chart below, also note that there is a gap to close at 10561.79.
The 10561.79 is a resistance level to keep an eye on.


