• 387 days Could Crypto Overtake Traditional Investment?
  • 392 days Americans Still Quitting Jobs At Record Pace
  • 394 days FinTech Startups Tapping VC Money for ‘Immigrant Banking’
  • 397 days Is The Dollar Too Strong?
  • 397 days Big Tech Disappoints Investors on Earnings Calls
  • 398 days Fear And Celebration On Twitter as Musk Takes The Reins
  • 400 days China Is Quietly Trying To Distance Itself From Russia
  • 400 days Tech and Internet Giants’ Earnings In Focus After Netflix’s Stinker
  • 404 days Crypto Investors Won Big In 2021
  • 404 days The ‘Metaverse’ Economy Could be Worth $13 Trillion By 2030
  • 405 days Food Prices Are Skyrocketing As Putin’s War Persists
  • 407 days Pentagon Resignations Illustrate Our ‘Commercial’ Defense Dilemma
  • 408 days US Banks Shrug off Nearly $15 Billion In Russian Write-Offs
  • 411 days Cannabis Stocks in Holding Pattern Despite Positive Momentum
  • 412 days Is Musk A Bastion Of Free Speech Or Will His Absolutist Stance Backfire?
  • 412 days Two ETFs That Could Hedge Against Extreme Market Volatility
  • 414 days Are NFTs About To Take Over Gaming?
  • 415 days Europe’s Economy Is On The Brink As Putin’s War Escalates
  • 418 days What’s Causing Inflation In The United States?
  • 419 days Intel Joins Russian Exodus as Chip Shortage Digs In
How The Ultra-Wealthy Are Using Art To Dodge Taxes

How The Ultra-Wealthy Are Using Art To Dodge Taxes

More freeports open around the…

Is The Bull Market On Its Last Legs?

Is The Bull Market On Its Last Legs?

This aging bull market may…

  1. Home
  2. Markets
  3. Other

Elliott Wave Analysis On Crude OIL And SP500

CRUDE OIL

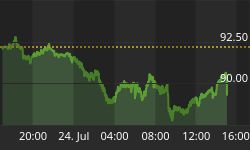
Crude oil is turning higher today from 44.50 area where market might have found a low. It's still a little early to confirm any reversal here, but further rise towards 47 and then 48.27 would definitely be important indication for a trend change. In that case we will look much higher in sessions and days ahead back to 50 and then even to new high of the year.

Crude OIL, 1H

Crude Oil 1-Hour Chart


S&P500

Stocks are in strong recovery, making a new leg up following good NFP report on Friday. On E-mini S&P500 there is a nice and strong move from 2080 to recent high which appears to be wave three of a five wave structure. As such, we will be looking for more upside after any small pauses. Well, it appears that recently we have seen fourth wave of wave 3 that is now pointing close to 2140 region.

S&P500

S&P500 1-Hour Chart


Interested in our services ? We have a Special Offer : Get First 2 Months For The Price Of 1!! Grab the opportunity now at www.ew-forecast.com


Back to homepage

Leave a comment

Leave a comment