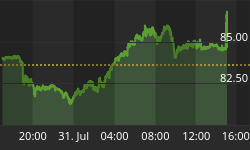
• 1,048 days Will The ECB Continue To Hike Rates?
  • 1,048 days Forbes: Aramco Remains Largest Company In The Middle East
  • 1,050 days Caltech Scientists Succesfully Beam Back Solar Power From Space
  • 1,450 days Could Crypto Overtake Traditional Investment?
  • 1,455 days Americans Still Quitting Jobs At Record Pace
  • 1,457 days FinTech Startups Tapping VC Money for ‘Immigrant Banking’
  • 1,460 days Is The Dollar Too Strong?
  • 1,460 days Big Tech Disappoints Investors on Earnings Calls
  • 1,461 days Fear And Celebration On Twitter as Musk Takes The Reins
  • 1,463 days China Is Quietly Trying To Distance Itself From Russia
  • 1,463 days Tech and Internet Giants’ Earnings In Focus After Netflix’s Stinker
  • 1,467 days Crypto Investors Won Big In 2021
  • 1,467 days The ‘Metaverse’ Economy Could be Worth $13 Trillion By 2030
  • 1,468 days Food Prices Are Skyrocketing As Putin’s War Persists
  • 1,470 days Pentagon Resignations Illustrate Our ‘Commercial’ Defense Dilemma
  • 1,471 days US Banks Shrug off Nearly $15 Billion In Russian Write-Offs
  • 1,474 days Cannabis Stocks in Holding Pattern Despite Positive Momentum
  • 1,475 days Is Musk A Bastion Of Free Speech Or Will His Absolutist Stance Backfire?
  • 1,475 days Two ETFs That Could Hedge Against Extreme Market Volatility
  • 1,477 days Are NFTs About To Take Over Gaming?
Zombie Foreclosures On The Rise In The U.S.

Zombie Foreclosures On The Rise In The U.S.

During the quarter there were…

The Problem With Modern Monetary Theory

The Problem With Modern Monetary Theory

Modern monetary theory has been…

  1. Home
  2. Markets
  3. Other

Elliott Wave Analysis On SP500 And Crude OIL

S&P500

SP500 broke out of a triangle in the minor wave iv and is now trading higher into wave v of 3. We see resistance for this wave 3 around 2.150, from where a new turnaround lower may occur in three waves with possible support seen around 2.124 region, where formal wave iv can act as a turning point higher.

S&P500, 1H

S&P500 1-Hour Chart


Crude OIL

On the intraday chart of Crude OIL, blue wave 4 seems to be completed, as recent sharp reversal higher has accomplished red wave C), last leg of a three wave correction. That said we are now looking bullish and expect higher levels to follow, but as we know nothing moves in straight lines, so we have to be aware of temporary corrective retracements.

Crude OIL, 1H

Crude Oil 1-Hour Chart


Interested in our services ? We have a Special Offer : Get First 2 Months For The Price Of 1!! Grab the opportunity now at www.ew-forecast.com


Back to homepage

Leave a comment

Leave a comment