



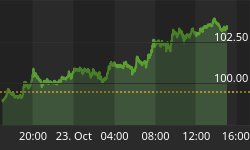


I was recently looking at the CNN money website where they post this fear & green index. I caught my attention because many other aspects of the market are now also showing signs an imminent correction in the stock market.
This analysis is a contrarians play, meaning you believe that when mass majority of market participants are thinking and doing the same thing, you believe the market is about to change direction.
Let me share with you a few data points that are screaming that the masses are overly bullish and on stocks, buying shares like they know what they are doing, and have no fear of stocks dropping in value.
Take a look at the fear & green index below from CNN money.
Notice the current level "Extreme Greed", and also the chart below showing the historical data. Its trading up near record levels and there is only one way to go from here - down!
What will change these participant's minds? Well, they need to see stock prices fall fast and hard and for the crap to get scared out of them before they change their line of thinking.

The total put/call ratio is something you may follow. I used to follow it, but now just focus on during what I feel is a critical turning point in the stock market, like right now.
This is a messy/noisy chart but the important thing to get out of this is that the black line that is down at extreme lows tells us everyone is betting and leveraging their money in anticipation of higher stock prices. There is a delay from when we see low reads like this till the market tops and that time looks to be any day now.
The red line on this chart is of the SP500 index, which will fall in value once this last bit of upward momentum stalls out.

The volatility index is trading near long term lows and "when the vix is low, its time to go", as the old saying says.
Below is not a chart of the vix but rather of a VIX ETF symbol VXX. I talked about this recently in a trading analysis video for subscribers of my ETF newsletter.
Long story short, you will should see the repeating price pattern that takes place. Because of the way VIX ETFs are built they naturally lose value over time, but that is not the point here. In fact, because of the natural price decay of this ETF it clearly exaggerates this repeating price pattern in the VIX would is very difficult to see without the exaggeration of price decay.

Conclusion to Greed, Volatility, and the Put/Call Ratio:
What does this chart point to? Well, keep in mind this is the WEEKLY chart. But in short, we should expect a BIG spike up in the VIX shortly and a sharp decline in stock prices.
There are many different ways one can play this next move. In one of my next articles I will share with you a couple very interesting VIX ETF trading strategies for this next move.
Get My Articles and ETF Trades Delivered To You Inbox: www.TheGoldAndOilGuy.com





