


The good news is:
• The blue chip indices and the S&P mid cap index closed at all time highs last week.
The Negatives
The blue chip indices have been hitting new highs while the secondaries are trading well off their all time highs.
The positives
The market has come through a seasonally weak period with good strength in the breadth indicators
The secondaries while still below their all time highs, have been outperforming the blue chips for the past several months.
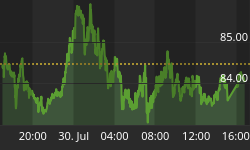
The first chart covers the past 6 months showing the NASDAQ composite (OTC) in blue and a 40% trend (4 day EMA) of NASDAQ new highs divided by new highs + new lows (OTC HL Ratio), in red. Dashed vertical lines have been drawn on the 1st trading day of each month. Dashed horizontal lines have been drawn at 10% levels for the indicator, the line is solid at the 50%, neutral level.
OTC HL Ratio was down for the week, but finished at a very strong 81%.

The next chart is similar to the one above except it shows the S&P 500 (SPX) in red and NY HL Ratio, in blue, has been calculated from NYSE data.
NY HL Ratio remained at a sensationally high 98%.

The next chart shows the OTC in blue and a 10% trend (19 day EMA) of NASDAQ new highs (OTC NH) in green.
OTC NH remained very strong.

The next chart is similar to the one above except is shows the SPX in red and NY NH has been calculated from NYSE data.
NY NH declined last week, but remains at a very comfortable level.

Seasonality
Next week includes the last 5 trading days of July during the 4th year of the Presidential Cycle. The tables below show the daily change, on a percentage basis for that period.
OTC data covers the period from 1963 to 2015 while SPX data runs from 1928 to 2015. There are summaries for both the 4th year of the Presidential Cycle and all years combined.
Average returns for the coming week have been mostly positive and stronger during the 4th year of the Presidential Cycle than other years.
Report for the last 5 days of July.
The number following the year represents its position in the Presidential Cycle.
The number following the daily return represents the day of the week;
1 = Monday, 2 = Tuesday etc.
| OTC Presidential Year 4 | ||||||
| Day5 | Day4 | Day3 | Day2 | Day1 | Totals | |
| 1964-4 | -0.02% 1 | -0.34% 2 | 0.02% 3 | 0.05% 4 | 0.10% 5 | -0.19% |
| 1968-4 | -1.00% 2 | -0.84% 4 | -1.41% 5 | 0.21% 1 | -1.28% 2 | -4.31% |
| 1972-4 | -0.23% 2 | 0.14% 3 | -0.23% 4 | -0.16% 5 | -0.31% 1 | -0.79% |
| 1976-4 | -0.13% 1 | -0.20% 2 | -0.32% 3 | -0.18% 4 | 0.48% 5 | -0.34% |
| 1980-4 | -0.17% 5 | 0.23% 1 | 0.61% 2 | 0.74% 3 | -0.30% 4 | 1.11% |
| 1984-4 | -0.19% 3 | 0.78% 4 | 0.99% 5 | -0.15% 1 | 0.33% 2 | 1.75% |
| 1988-4 | -0.06% 1 | -0.34% 2 | -0.64% 3 | 0.20% 4 | 0.85% 5 | 0.00% |
| 1992-4 | -0.16% 1 | 1.22% 2 | 1.03% 3 | 0.23% 4 | 0.35% 5 | 2.67% |
| Avg | -0.14% | 0.34% | 0.33% | 0.17% | 0.34% | 1.04% |
| 1996-4 | 1.92% 4 | 1.60% 5 | -1.20% 1 | 0.52% 2 | 0.80% 3 | 3.64% |
| 2000-4 | 1.21% 2 | -1.04% 3 | -3.65% 4 | -4.66% 5 | 2.84% 1 | -5.31% |
| 2004-4 | -0.54% 1 | 1.64% 2 | -0.58% 3 | 1.23% 4 | 0.33% 5 | 2.07% |
| 2008-4 | 1.33% 5 | -2.00% 1 | 2.45% 2 | 0.44% 3 | -0.18% 4 | 2.03% |
| 2012-4 | -0.31% 3 | 1.37% 4 | 2.24% 5 | -0.41% 1 | -0.21% 2 | 2.67% |
| Avg | 0.72% | 0.31% | -0.15% | -0.58% | 0.72% | 1.02% |
| OTC summary for Presidential Year 4 1964 - 2012 | ||||||
| Averages | 0.13% | 0.17% | -0.05% | -0.15% | 0.29% | 0.39% |
| % Winners | 23% | 54% | 46% | 62% | 62% | 62% |
| MDD 7/28/2000 9.10% -- 7/30/1968 4.25% -- 7/28/2008 2.00% | ||||||
| OTC summary for all years 1963 - 2015 | ||||||
| Averages | 0.01% | 0.04% | -0.11% | 0.00% | -0.05% | -0.10% |
| % Winners | 53% | 47% | 45% | 62% | 49% | 58% |
| MDD 7/28/2000 9.10% -- 7/31/1974 6.22% -- 7/31/1969 4.97% | ||||||
| SPX Presidential Year 4 | ||||||
| Day5 | Day4 | Day3 | Day2 | Day1 | Totals | |
| 1928-4 | 0.21% 4 | 0.94% 5 | 0.26% 6 | 0.00% 1 | -0.21% 2 | 1.20% |
| 1932-4 | -1.46% 2 | 5.00% 3 | 3.17% 4 | 3.08% 5 | 1.16% 6 | 10.95% |
| 1936-4 | 1.00% 1 | -6.38% 2 | 5.56% 3 | 0.38% 4 | -1.06% 5 | -0.51% |
| 1940-4 | 0.50% 5 | 0.40% 6 | 0.70% 1 | 2.48% 2 | -0.39% 3 | 3.70% |
| 1944-4 | -0.23% 3 | 0.00% 4 | -0.55% 5 | 0.00% 6 | 0.08% 1 | -0.70% |
| 1948-4 | -0.92% 1 | 1.05% 2 | -0.68% 3 | -0.80% 4 | -1.25% 5 | -2.59% |
| 1952-4 | -0.32% 5 | 0.16% 1 | 0.24% 2 | 0.44% 3 | 0.12% 4 | 0.63% |
| Avg | 0.01% | -0.95% | 1.05% | 0.50% | -0.50% | 0.11% |
| 1956-4 | 0.22% 3 | 0.08% 4 | -0.81% 5 | -0.16% 1 | 0.80% 2 | 0.13% |
| 1960-4 | -0.99% 1 | 0.61% 2 | -0.62% 3 | 0.74% 4 | 1.72% 5 | 1.46% |
| 1964-4 | -0.46% 1 | -0.28% 2 | 0.08% 3 | 0.21% 4 | 0.11% 5 | -0.33% |
| 1968-4 | -0.12% 2 | -1.28% 4 | 0.41% 5 | -0.70% 1 | 0.09% 2 | -1.60% |
| 1972-4 | -0.30% 2 | -0.07% 3 | -0.23% 4 | 0.09% 5 | 0.01% 1 | -0.49% |
| Avg | -0.33% | -0.19% | -0.23% | 0.03% | 0.55% | -0.17% |
| 1976-4 | 0.01% 1 | -0.57% 2 | -0.42% 3 | -0.12% 4 | 0.50% 5 | -0.59% |
| 1980-4 | -0.83% 5 | 0.54% 1 | 0.80% 2 | -0.14% 3 | -0.46% 4 | -0.09% |
| 1984-4 | 0.68% 3 | 0.84% 4 | 0.74% 5 | -0.66% 1 | 0.31% 2 | 1.91% |
| 1988-4 | 0.45% 1 | 0.19% 2 | -1.01% 3 | 1.34% 4 | 2.26% 5 | 3.22% |
| 1992-4 | -0.01% 1 | 1.45% 2 | 1.13% 3 | 0.40% 4 | 0.07% 5 | 3.04% |
| Avg | 0.06% | 0.49% | 0.25% | 0.16% | 0.53% | 1.50% |
| 1996-4 | 0.72% 4 | 0.75% 5 | -0.79% 1 | 0.69% 2 | 0.74% 3 | 2.11% |
| 2000-4 | 0.69% 2 | -1.50% 3 | -0.19% 4 | -2.05% 5 | 0.77% 1 | -2.27% |
| 2004-4 | -0.20% 1 | 0.99% 2 | 0.05% 3 | 0.46% 4 | 0.12% 5 | 1.42% |
| 2008-4 | 0.42% 5 | -1.86% 1 | 2.34% 2 | 1.67% 3 | -1.31% 4 | 1.25% |
| 2012-4 | -0.03% 3 | 1.65% 4 | 1.91% 5 | -0.05% 1 | -0.43% 2 | 3.05% |
| Avg | 0.32% | 0.01% | 0.66% | 0.14% | -0.02% | 1.11% |
| SPX summary for Presidential Year 4 1928 - 2012 | ||||||
| Averages | -0.04% | 0.12% | 0.55% | 0.33% | 0.17% | 1.13% |
| % Winners | 45% | 64% | 59% | 55% | 68% | 59% |
| MDD 7/28/1936 6.38% -- 7/28/2000 3.70% -- 7/30/1948 2.70% | ||||||
| SPX summary for all years 1928 - 2015 | ||||||
| Averages | -0.05% | 0.04% | 0.09% | 0.15% | 0.05% | 0.27% |
| % Winners | 55% | 57% | 52% | 62% | 60% | 57% |
| MDD 7/26/1934 7.83% -- 7/31/1933 6.84% -- 7/31/1974 6.68% | ||||||
Conclusion
Last week was encouraging. The breadth indicators held up well while prices weakened a little.
I expect the major averages to be higher on Friday July 29 than they were on Friday July 22.
Last weeks negative forecast was a miss.
This report is free to anyone who wants it, so please tell your friends. They can sign up at: http://www.stockmarket-ta.com/signup.html. If it is not for you, reply with REMOVE in the subject line.
These reports are archived at: http://www.safehaven.com/
Good Luck,
YTD W 12 / L 14 / T 3


