


Market Summary
The S&P and Dow have broken to all-time records in the past two weeks for the first time in more than a year amid positive quarterly earnings reports. Wall Street rose and clinched the fourth straight positive week for the stock market. "Below it all is just an ongoing trend of better economic reports," said Jim Paulsen, chief investment strategist at Wells Capital Management in Minneapolis. "Some of those are earnings reports, but they all line up to the same thing: It looks like growth is quickening." For the week, the S&P 500 was basically flat up .6% as was Blue Chip-heavy Dow Jones Industrial Average rising .2%. The Nasdaq Index was the big mover climbing 1.4% while the small cap Russell 2000 advanced .6%.

A standard chart that we use to help confirm the overall market trend is the Momentum Factor ETF (MTUM) chart. Momentum Factor ETF is an investment that seeks to track the investment results of an index composed of U.S. large- and mid-capitalization stocks exhibiting relatively higher price momentum. This type of momentum fund is considered a reliable proxy for the general stock market trend. We prefer to use the Heikin-Ashi format to display the Momentum Factor ETF. Heikin-Ashi candlestick charts are designed to filter out volatility in an effort to better capture the true trend. In the updated chart below the stock market remains extremely overbought, but an overbought condition can remain indefinitely. However, as highlighted, bullish momentum has dissipated and is trying to turn down. The best bet for the near term market is continued sideways price movement to absorb the overbought condition.

Last week we said "...the DOW Transportation index is starting to diverge from the Dow Jones Industrial Average. We look for DOW Transports and Industrials to move in synch for confirmation of the current trend...If the Transports follow through on the pullback that is another signal the upward move is losing steam..." In the updated graph below you can see how the Transportation index has reversed course and moved back up to synch with the Industrials index to confirm the uptrend.

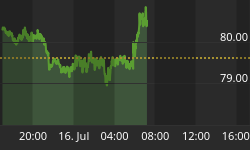
The dollar ended the week at its highest level since early March, as weak data from Europe softened the pound and the euro, while the yen retreated from a strong rally a day earlier. You can see in the chart below how global demand for U.S. assets is driving up the dollar. After Treasury bond prices rose to all-time highs in the first week of July they dropped sharply in the second week as investors starting selling off safe-haven assets like bonds and gold.

Market Outlook
Danny Riley discussed in MrTopStep how the markets tend to go quiet after a big directional move, but they also slow down as the summer grinds on. Traders take money out of their accounts to go on vacations, volume drops, and the trading ranges get thin. Also, The Stock Trader's Almanac talks about how they refer to the summer months as the doldrums due to the anemic volume and uninspired trading on Wall Street. The individual trader, if they are looking to sell a stock, is generally met with disinterest from The Street. It becomes difficult to sell a stock at a good price. That is also why many summer rallies tend to be short lived and are quickly followed by a pullback or correction. As we have reported recently "...The equity market is telling you the second quarter economy looks better than the first quarter," said Art Hogan, chief market strategist at Wunderlich Securities in New York. He said if earnings season, which begins in earnest next week, provides investors with a strong outlook; the S&P will likely break the record and has a chance at rallying from there. "The old high has been resistance and if you break it and see earnings growth and relatively good guidance, people will probably try to get in front of that," said Hogan..." In the 3rd quarter graph below investors are aggressively trading "risk-on" buying higher risk asset classes and backing off of safe-haven assets like gold and bonds.

Put/Call Ratio is the ratio of trading volume of put options to call options. The Put/Call Ratio has long been viewed as an indicator of investor sentiment in the markets. Times where the number of traded call options outpaces the number of traded put options would signal a bullish sentiment, and vice versa. Technical traders have used the Put/Call Ratio for years as an indicator of the market. Most importantly, changes or swings in the ratio are seen as instances of great importance as this is commonly viewed as a change in the tide of overall market sentiment. The current ratio indicates traders remain bullish during the middle of quarterly earnings season as they invest in option call contracts to bet on higher stock prices.

The CBOE Volatility Index (VIX) is known as the market's "fear gauge" because it tracks the expected volatility priced into short-term S&P 500 Index options. When stocks stumble, the uptick in volatility and the demand for index put options tends to drive up the price of options premiums and sends the VIX higher. Last week's comment "...The ‘Fear Gauge' continues to exhibit little concern for any downside risk at this point. Since peaking right after the June 23rd Brexit vote...the S&P achieved all-time highs the Volatility Index has sank to the lowest level since last summer. As long as stocks remain near lofty heights, expect the VIX to remain suppressed as investors are complacent..." As circled in the chart below, downward momentum has diminished. Don't be surprised if Volatility rises higher over the next few weeks as the market stalls from being overbought.

The American Association of Individual Investors (AAII) Sentiment Survey measures the percentage of individual investors who are bullish, bearish, and neutral on the stock market for the next six months; individuals are polled from the ranks of the AAII membership on a weekly basis. The current survey result is for the week ending 07/20/2016. Optimism remained below average despite the further ascent by the Dow Jones industrial average and the S&P 500 index into record territory. Part of the reason is that AAII members have mixed thoughts about the record highs. The further ascent by the Dow Jones industrial average and the S&P 500 index into record territory did not translate into higher optimism among individual investors. The latest AAII Sentiment Survey shows bullish sentiment -- as well as neutral sentiment -- declining, and bearish sentiment rising. The changes were modest, however. Bullish sentiment, expectations that stock prices will rise over the next six months, pulled back by 1.4 percentage points to 35.4%. Optimism is below its historical average of 38.5% for the 37th consecutive week and the 70th out of the past 72 weeks. Neutral sentiment, expectations that stock prices will stay essentially unchanged over the next six months, slipped 0.9 percentage points to 37.9%. Nonetheless, neutral sentiment is above its historical average of 31.0% for the 25th consecutive week. Bearish sentiment, expectations that stock prices will fall over the next six months, rebounded by 2.3 percentage points to 26.7%. Pessimism was last lower on April 20, 2016 (23.9%). The historical average is 30.5%. While optimism among individual investors remains below average, it has still shown recent signs of improvement, with bullish sentiment above 30% for the third consecutive week. To put this into perspective, optimism has only stayed above 30% for a span of three consecutive weeks just one other time this year (February 24 through March 9).

The National Association of Active Investment Managers (NAAIM) Exposure Index represents the average exposure to US Equity markets reported by NAAIM members. The blue bars depict a two-week moving average of the NAAIM managers' responses. As the name indicates, the NAAIM Exposure Index provides insight into the actual adjustments active risk managers have made to client accounts over the past two weeks. The current survey result is for the week ending 07/20/2016. Second-quarter NAAIM exposure index averaged 60.52%. Last week the NAAIM exposure index was 96.52%, and the current week's exposure is 92.64%. As we said last week "...You can see in the graph below that professional money managers have gone "all in" and are almost fulling invested in stocks, this supports the historic market rebound over the past few weeks. But if there is a selloff the market will fall hard and fast as money managers will look to rapidly unwind their positons. Also, there is minimal opportunity for further stock accumulation as investors already have most of their funds in the market, this supports the analysis suggesting upward price movement is due for a pause..." Stocks continue grinding higher but the upward move has decelerated.

Trading Strategy
A lack of perceived viable investment alternatives, economic growth and upward momentum in stock prices is encouraging some individual investors about the short-term direction of stock prices. According to the Stock Trader's Almanac the S&P 500 ETF SPY has traded on average 100 million shares over the last three months and then down to 54 million shares this past Tuesday. Jeff Hirsch writes, "If volatility remains subdued, average daily volume is likely to continue to trend lower as the calendar heads toward August." The best strategy is to continue selling into market rallies and using price dips to buy shares.

Feel free to contact me with questions,


