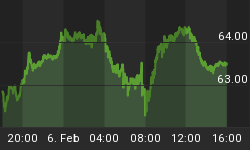
Today's posted chart show's the VIX going back to September 2014.
When you look at the chart, the VIX has a long term support line that it has been coming closer to. At the same time, the past few days have shown the VIX moving higher on the short term.
A higher VIX equals a lower market since they are inverse to each other. Therein comes the risk for you, so please keep an eye on the VIX.


