


EURJPY
EURJPY is trading nicely higher today, probably in a new impulse, that could reach new highs. We see price in blue wave iv, which could be an unfolding triangle, meaning that one more wave to the upside may unfold, after its completion.
EURJPY, 1H

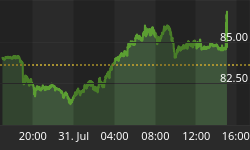
10 Year US Notes
On the 10 Year US Notes chart we see that price is trading in a new contra trend movement, probably in a three wave consolidation, with price now in blue wave B. After blue wave B is finished, we may see a rally towards 133 area, from where a new impulsive drop may occur.
10 Year US Notes, 4H

Interested in our services ? Visit our page at www.ew-forecast.com


