


215,000 jobs outside the farm sector were said to be added in November. Interestingly, this payroll number's right on the money as the market's expecting an increase of 210,000 jobs in November. President Bush seized the opportunity and cited "our economy horizon is as bright as it's been in a long time." Meanwhile, the latest Wall Street Journal/NBC News poll conducted in November, found just 34% of respondents approving of Mr. Bush's handling of the economy, down from 47% in January.
Public opinion is not the only dissident. Andrew Samwick, Professor of Economics at Dartmouth College, also raised a few intriguing questions about the latest employment report. One that might've been overlooked by many is the tiny 6 minutes (0.10 hours) of hours of work decrease in November. The hours of work pertained to private production or nonsupervisory workers, which represent four-fifths (80%) of the total nonfarm payroll employment. According to Prof. Samwick's calculation, this drop-off of mere 6 minutes was the equivalence of a reduction in labor input of 10.56 million hours or 312,000 workers. This more than outweighs the increase in the number of nonfarm payroll jobs added. "So overall, the economy didn't appear to increase its demand for labor input to production in November," said Prof. Samwick.
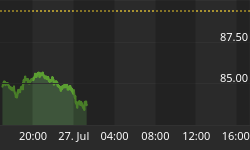
The bond market, which is many times larger than the stock market, seems to be in agreement with both the public opinion and Prof. Samwick. The bond yields of various maturities (Chart 1) show little movement in November, during which this robust hiring activities supposedly have taken place. The short-term 3-month Treasury yield (aqua color curve), in particular, started and ended the month unchanged, at 3.86%.

Chart 1
Instead of seeing a bright "economy horizon", the bond market's seeing something different. It's seeing a flattening yield curve (a.k.a. Term Structure of Interest Rates) that's getting dangerously close to becoming inverted. Invalidate and discredit it as you may, an inverted yield curve has an almost flawless ability to predict a recession. Over the past 20 years the yield curve has become inverted seven times. Six of those times the economy was in a recession 6 to 9 months later.
By all means, the yield curve that's frequently referred to is a line that plots the yield differentials of 4 or 5 of the U.S. Treasury debt of various maturities. Sometimes, on the daily basis, it's difficult to visualize any discernable movement of this curve. It's much easier for me to compare just a pair of the Treasury yields at a time. The pair that lends the best inversed correlation with the S&P broad market index is the 5-year and the 10-year yield comparison.
Chart 2 shows the shorter term bond yield (5-year) exceeded the longer term (10-year) bond yield in the beginning of year 2000, which brought the black yield differential line below zero - below the thick horizontal black line. The S&P 500 Index (red line) rolled over shortly after that. In the 2nd quarter of 2003, S&P started rallying when the yield differential widened to approx. 1.20% (a very steep yield curve). This year, while Wall Street's reveling in a Santa Clause rally and the President's claiming credit for our "booming" economy, the difference between the 5-year and the 10-year Treasury yields is once again approaching zero. Essentially, the bond market's predicting at least an economic slowdown, if not a recession.

Chart 2
Chart 3 shows a steady decline of the yield differential (a flattening yield curve) since the beginning of the New Year. The difference between the 5-year and the 10-year bond yields was only 0.05 apart on Nov. 16. It had bounced back but dropped down to 0.07 again on Friday, Dec. 2, 2005. Similar flattening pattern can be seen across the board.

Chart 3
Chart 4 shows the difference between the 10-year and the 30-year T-bond yields also appears to be headed toward zero. All these yield curve charts unanimously confirm that the stock market's in the process of topping out. There's trouble ahead.

Chart 4
If you hadn't been worrying about the possibility of an inverted yield curve, now might just be a good time to start.


