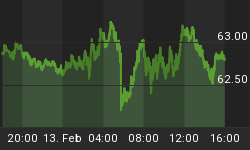
The chart below is from yesterday's close and it show's the VIX (Volatility Index) back to early 2014.
If you look at the chart, the VIX has a long term support line that it is finally testing.
Remember ... that a higher VIX equals a lower market since they are inverse to each other. Therein comes the risk for you, so please keep an eye on the VIX.


