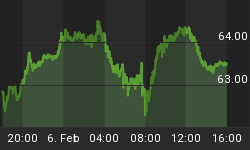
The chart below is from yesterday's VIX close and it show's the VIX (Volatility Index) back to early 2014.
If you look at the chart, the VIX has a long term support line that it has been testing. I can't say the test is done quite yet since the VIX is still in a technical down trend. (Do remember that the VIX moves opposite to the stock market.)
What happens to that technical down trend will be important as to what happens in the stock market, so keep an eye on the VIX.


