


Forex Trading Alert originally published on Aug 18, 2016, 7:50 AM
Earlier today, the USD Index extended losses against its Canadian counterpart after the disappointing minutes of the Federal Reserve's policy meeting (they vanished expectations for a September rate hike) continued to weigh on investors' sentiment. Additionally, rising prices of crude oil supported Canadian currency, which pushed USD/CAD under 1.2800. What's next for the exchange rate?
In our opinion, the following forex trading positions are justified – summary:
EUR/USD: none
GBP/USD: short (stop-loss at 1.3579; initial downside target at 1.2519)
USD/JPY: none
USD/CAD: none
USD/CHF: none
AUD/USD: none
In other words we closing yet another profitable trade by taking profits off the table in case of USD/CHF and USD/CAD.
EUR/USD

Looking at the weekly char, we see that EUR/USD extended gains and climbed above the medium-term brown resistance line, invalidating earlier breakdown. Taking this positive signal (which would be even bullish if the exchange rate closes the week above this line) and buy signals generated by the indcators into account, we think that further improvement is likely.
How high could the pair go in the coming day(s)? Let's examine the very short-term chart and find out.

From this perspective, we see that although EUR/USD slipped under the brown resistance line yesterday, currency bulls managed to stop decline and trigger an upswing. As a result, the exchange rate invalidated earlier breakdown, which suggests a test of the upper border of the blue rising trend channel in the coming days. At this point, it is also worth noting that this area is also reinforced by the 70.7% Fibonacci retracement and Jun highs, which increases the probability of reversal in near future – especially when we factor in the current position of the daily indicators (the CCI and Stochastic Oscillator are overbought and quite close to generating sell signals).
Very short-term outlook: bullish
Short-term outlook: mixed
MT outlook: mixed
LT outlook: mixed
Trading position (short-term; our opinion): No positions are justified from the risk/reward perspective at the moment.
USD/CAD

Last Friday, we wrote the following:
(...) USD/CAD reversed and declined, which resulted in a comeback to the blue consolidation (an invalidation of earlier breakout above the upper line of the formation is a negative signal – especially if the exchange rate closes the week below it).
On the above chart, we see that the situation developed in line with the above scenario and the pair closes the previous week inside the consolidation. This negative event triggered further deterioration this week, which in combination with sell signals generated by the indicators suggests a test of the lower line of the formation.
Are there any technical factors that may stop currency bears in the coming days? Lets focus on the daily chart and find out.

Quoting our Tuesday's alert:
(...) The pair extended losses and slipped under the mid-Jul lows, which suggests further deterioration and a test of the upper border of the red medium-term support line (around 1.2800) in the coming day(s).
From today's point of view, we see that currency bears pushed the pair lower as we had expected. With this downswing, USD/CAD reached our downside target on Tuesday. As you see, although the upper border of the red medium-term support line triggered a rebound yesterday, the exchange rate slipped lower earlier today, hitting our target once again. Taking this fact into account and combining it with the proximity to the red line (which serves as the nearest support) and the Fibonacci retracements (slightly below current levels is a support area created by the 76.4% and 78.6% retracements), we think that reversal and higher values of USD/CAD are just around the corner (this scenario is also reinforced by the current position of the daily indicators, which are very close to generating buy signals). Therefore, in our opinion, closing short positions (we opened them when USD/CAD was trading around 1.2972) and taking profits off the table is justified from the risk/reward perspective.
Very short-term outlook: mixed with bullish bias
Short-term outlook: mixed
MT outlook: mixed
LT outlook: mixed
Trading position (short-term; our opinion): No positions are justified from the risk/reward perspective at the moment.
USD/CHF


On Tuesday, we wrote the following:
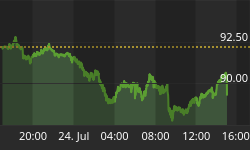
(...) the pair moved significantly lower (making our short positions more profitable) and broke below the Jul and early Aug lows, which is a negative signal that suggests a test of the medium-term blue support line in the coming days.
Looking at the charts, we see that the situation evolved in tune with our forecast and USD/CHF slipped under our downside target. As you see on the daily chart, slightly below current levels is a green support zone (created by the 61.8% Fibonacci retracement based on the entire May-Nov 2015 upward move and the 76.4% and 78.6% retracement levels based on the May 2016 increases), which in combination with the current position of the daily indicators suggests reversal and rebound in the coming day(s). Therefore, closing another profitable positions (as a reminder, we opened short positions when USD/CHF was trading around 0.9756) is justified from the risk/reward perspective at the moment.
Very short-term outlook: mixed with bullish bias
Short-term outlook: mixed
MT outlook: bearish
LT outlook: mixed
Trading position (short-term; our opinion): No positions are justified from the risk/reward perspective at the moment.
Thank you.


