


Market Summary
The dog days of summer are among us, earnings season is over and investors are in pause mode with the popular indices near all-time highs," said Terry Sandven, chief equity strategist at U.S. Bank Wealth Management in Minneapolis. The major equity indexes basically finished the week flat with the S&P 500 Index finishing down 0.01% and the Blue Chip-heavy Dow Jones Industrial Average falling 0.1%. The Nasdaq increased .1% while the small cap Russell 2000 fell 0.6%. For the year, gold stocks are at a stratospheric level up 120%. Treasury bonds are the next best performer up almost 17% in a low rate environment. Over the past month all the major equity indexes have been in the black year-to-date for the first time this year.

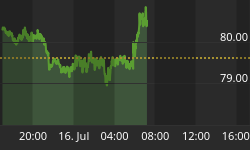
In the chart below you can see that the dollar has been heading lower after Fed comments dampened expectations for an interest rate hike before the end of the year. Dollar denominated assets like treasury bonds and gold have stabilized higher after the Federal Reserve cast doubt about the scope and speed of any rate hikes.

The CBOE Volatility Index (VIX) is known as the market's "fear gauge" because it tracks the expected volatility priced into short-term S&P 500 Index options. When stocks stumble, the uptick in volatility and the demand for index put options tends to drive up the price of options premiums and sends the VIX higher. Volatility remains near record lows during this typically slow summer season. The Fed has hinted at continued lower rates, which remove any potential surprise about a sudden rate increase, plus earning season is winding down to further suppress volatility.

The American Association of Individual Investors (AAII) Sentiment Survey measures the percentage of individual investors who are bullish, bearish, and neutral on the stock market for the next six months; individuals are polled from the ranks of the AAII membership on a weekly basis. The current survey result is for the week ending 08/17/2016. Optimism about the six-month direction of stock prices is at a five-week high in the latest AAII Sentiment Survey. Neutral sentiment fell and pessimism is slightly lower. Bullish sentiment, expectations that stock prices will rise over the next six months, jumped 4.3 percentage points to 35.6%. Optimism was last higher on July 13, 2016 (36.9%). The increase is not large enough to prevent bullish sentiment from staying below its historical average of 38.5% for the 41st consecutive week and the 74th out of the past 76 weeks. Neutral sentiment, expectations that stock prices will stay essentially unchanged over the next six months, fell 3.9 percentage points to 38.1%. Neutral sentiment was last lower on June 29, 2016 (37.7%). Even with the decline, neutral sentiment is above its historical average of 31.0% for the 29th consecutive week. Bearish sentiment, expectations that stock prices will fall over the next six months, declined 0.4 percentage points to 26.4%. This is the seventh consecutive week that pessimism is below its historical average of 30.5%. It is also the fifth time in seven weeks that bearish sentiment has been within a 0.3-percentage-point range. The improvement in sentiment is occurring as the large-cap indexes continue to trade at or near record highs and small-cap stocks are experiencing upward momentum. Most individual investors are keeping their outlook tempered, however. This week is just the sixth in this calendar year with more than one out of three survey respondents describing themselves as being bullish about the six-month direction of stock prices. Optimism has not been above its historical average of 38.5% since November 4, 2015, when it registered 39.0%. This summer's upward movement in stock prices, the perceived lack of investment alternatives and sustained, albeit slow, economic growth are giving some individual investors reason to be optimistic.

The National Association of Active Investment Managers (NAAIM) Exposure Index represents the average exposure to US Equity markets reported by NAAIM members. The blue bars depict a two-week moving average of the NAAIM managers' responses. As the name indicates, the NAAIM Exposure Index provides insight into the actual adjustments active risk managers have made to client accounts over the past two weeks. The current survey result is for the week ending 08/17/2016. Second-quarter NAAIM exposure index averaged 60.52%. Last week the NAAIM exposure index was 92.86%, and the current week's exposure is 98.79%. Money managers responded favorably to the expectation that the Fed will not be lowering interest rates anytime soon. NAAIM members pushed the exposure index back up toward the highest levels in well over a year.

Trading Strategy
The graph below shows Technology shares continuing to lead the market higher. Goldman Sachs earlier this week released its list of "stocks that matter most," representing a compilation of the securities that show up most frequently among the top 10 holdings of hedge-fund portfolios, and tech shares are all over the list. Recent comments are still valid where we said "... The major concern is that the market advance is not broad-based. Tech shares leading the market higher are not dragging along the other S&P sectors. The smart move is hedge long-term positions to protect gains in the event of a market pullback..."

Feel free to contact me with questions,


