"Do not let yourself be tainted with a barren skepticism." ~ Louis Pasteur
The market has resisted all attempts to correct. We know why it is not crashing; this has to do with mass psychology, but what's preventing it from letting out a significant dose of steam. The table below might hold the answer.  We looked at all 30 components of the Dow monthly timelines utilising our indicators, and the results were quite surprising, to say the least. On the monthly charts, each bar represents one month's worth of data so these are long-term charts, and they usually provide a much clearer picture of what the futures holds as opposed to the shorter term charts.
| Symbol | Monthly Chart Pattern |
CAT | oversold |
AXP | Oversold |
AAPL | Extremely oversold |
MMM | Oversold |
BA | oversold |
CVX | Oversold |
CSCO | Extremely oversold |
DIS | oversold |
KO | Oversold |
DD | Oversold |
XOM | Oversold |
GE | Oversold |
GS | Oversold |
HD | oversold |
IBM | Oversold |
JNJ | Overbought |
MCD | Extremely overbought |
JPM | Slightly oversold |
MRK | oversold |
MSFT | Oversold |
NKE | Oversold |
PFE | Oversold |
PG | Slightly oversold |
TRV | Oversold |
UTX | Oversold |
UNH | Oversold |
VZ | Slightly oversold |
V | Oversold |
WMT | Slightly oversold |
28 components of the Dow are trading in the oversold ranges varying from mild to extremely oversold; conventional logic would have you believe that all the elements of the Dow would be trading in the overbought ranges, but that is not the case.
Conclusion
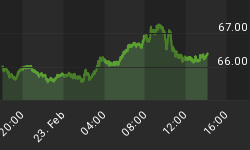
The strength the Dow 30 stocks are showing on the monthly charts clearly indicates that the most hated stock market bull still has plenty of room to run before it drops dead from exhaustion. However, at the moment the stock market is rather overbought, and we covered this very recently in an article titled "mass media turns bullish; stock market correction likely," so it would not surprise us if it let us some steam. In fact, we would view it as a bullish and healthy development if the market were topullback before trending higher. Oil and the Dow tend to trend together; oil pulled back, bottomed out in the 39-40 ranges as expected and is now trending upwards.
The Dow could take a similar path; experience a mild to moderate correction and then move up to new highs.
"We have more ability than will power, and it is often an excuse to ourselves that we imagine that things are impossible." ~ Francois De La Rochefoucauld


