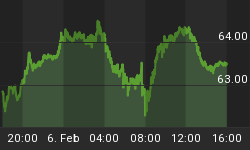
The current VIX Index (Volatility Index) chart is posted below with 16 months of daily ticks.
There are a few things to note on this chart ...
1. The trend has been down with each successive peak being lower. (A lower VIX correlates with a higher stock market and a higher VIX with a lower stock market.)
2. The last peak breached the resistance line which is normally a not so good sigh for later on.
3. We don't know for sure if the VIX is done moving higher right now, but historically it should finish its up movement by moving higher in the next few days.
4. The bottom support line has not been breached and that could be where the danger may is.


