


The BEA's Personal Income and Outlays report shows personal incomes rose 0.3%.
"Real DPI increased less than 0.1 percent in September and Real PCE increased 0.3 percent."
Spending rose 0.5% but the BEA revised August from +0.0% to -0.1% so effectively spending increased 0.4% from the unrevised number.

Econoday Consensus
The reported numbers were mostly in-line with the Econoday Consensus Estimates.

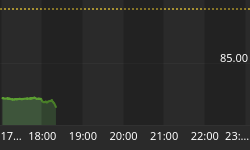
Real Disposable Personal Income Year-Over-Year

Econoday calls the report "solid" but sees the inflation data as "mixed to soft".
The Econoday parrot is always happy when consumers have less real money to spend. The above chart simply is too "soft".
The parrot would have been happier had inflation advanced more and consumers effectively made nothing.


