


USDJPY
USDJPY is trading quite nicely, now in a probable corrective blue wave iv as part of a higher degree impulse. If that is correct, then we can say that red wave a) and b) are already over and an ideal drop may be in the cards for the final sub-wave c). The support for this whole corrective structure may be seen around the former wave iv) at the 107.76 level, from where bears may slow down and bulls can take over.
USDJPY, 1H

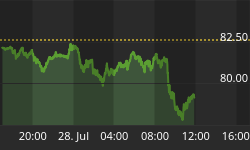
USDCAD
USDCAD keeps trading lower, ideally within a higher degree wave 1 with almost all five needed sub-waves visible. As we can see on the chart, we are tracking a possible leading diagonal in the first wave 1, a reversal pattern that can after its completion push price higher within the upcoming wave 2 correction. At the moment we still need one more push to the downside, before this three wave consolidation may follow.
USDCAD, 1H

When diagonal triangles occur in the fifth or C wave position, they take the 3-3-3-3-3 shape that Elliott described. However, it has recently come to light that a variation on this pattern occasionally appears in the first wave position of impulses and in the A wave position of zigzags. The characteristic overlapping of waves one and four and the convergence of boundary lines into a wedge shape remain as in the ending diagonal triangle. However, the subdivisions are different, tracing out a 5-3-5-3-5 pattern.
Basic Leading Diagonal Pattern:

Interested in our services? We have a Special Offer: Get 14 Days Access For 1€!! Grab the opportunity now at www.ew-forecast.com You can even subscribe to our Twitter account -> @ewforecast


