


Long term count:

4HR chart:

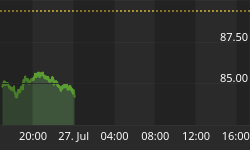
30 min chart

My Bias: Neutral big downside risks.
Wave Structure: Impulsive 5 wave structure, possibly topping in an all time high.
Short term wave count: Upside from 17,066 wave 4 blue
Long term wave count: Topping in wave (5)
Important risk events: USD: FOMC Meeting Minutes.
I have updated the wave count today to account for the gap up out of the open today.
That rally and decline can be viewed as an ongoing wave 2 red.
The decline off the all time high can be counted in five waves to complete wave 1 red.
Wave 2 red should trace out three internal waves and the price could be moving up in wave c of that correction now.
19987 is the critical high right now, a break of this high will mean a slight rethink of the short term wave count.
The larger count is sound, we are at or very near one of the greatest stock market tops of all time right now.
This top could challenge 1929 in terms of the havoc and wealth destruction that followed that high.
With that in mind, I am speaking of declines in the region of 80% or even more!
The lows that are to come in the future could also be the greatest buying opportunity that ever existed!
So at this moment I am SUPER bearish on the DOW, but also anticipating the great low in asset prices that is to follow the coming crash.
At that low, generational wealth will be created, for those that are savvy enough to hold onto some capital to deploy at the low.
But first of all, there is a very significant selling opportunity at nearby highs to deal with.
The current short term wave count is labelled in the most bearish possible wave count.
Lets see how the next few days play out before we test the downside.


