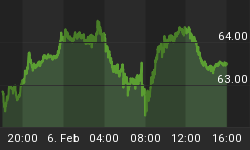
Gold and Gold stocks have rallied as expected and the consolidation in the miners in recent days looks bullish. GDX and GDXJ have digested the recent recovery quite well as Gold is testing resistance around $1200/oz. While the price action portends to more gains so does the breadth in the miners as well as short-term structure in the US$ index and bond yields.
In the first chart we plot GDX along with its advance decline (AD) line at the top. The AD line is the holy grail of breadth indicators as it is a trusty leading indicator. At the January 2016 bottom, the AD line was showing a strong positive divergence. Presently, the AD line is trading at a 3.5 month high and above its October 2016 high. If GDX were trading at the same relative level then it would be about 17% higher. Moreover, the AD line only retraced 38% of its 2016 advance while GDX retraced 62% of its advance. This suggests continued strength in the gold stocks.

The current short-term trends in the US$ and bond yields also support more gains in the precious metals complex. The US$ index tried but failed to break 103.50 and should test at least 100. It could potentially decline to as low as 97 and test the 200 and 400-day moving averages. Meanwhile, it is no secret that bonds (like Gold) became extremely oversold (and yields extremely overbought). The 10-year yield, which closed at 2.38% should test at least 2.20% and could fall to 2.10%. Declining yields are immediately bullish for precious metals.Â

Strong breadth coupled with continued weakness in the US$ index and bond yields supports more gains in both Gold and the gold stocks. Our targets for the miners remain $25 for GDX and $40 for GDXJ. Those are the strongest and most reasonable targets but $26-$27 for GDX and $41-$42 for GDXJ are possible. Look for Gold to test $1220/oz while maximum upside on this rally is $1250/oz. We have turned more constructive on the miners but definitely expect another buying opportunity after the US$ and bond yields resume their uptrends.
For professional guidance in riding the bull market in Gold, consider learning more about our premium service including our favorite junior miners for 2017.


