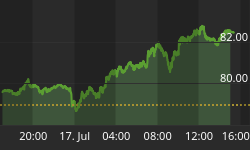
• 618 days Will The ECB Continue To Hike Rates?
  • 619 days Forbes: Aramco Remains Largest Company In The Middle East
  • 620 days Caltech Scientists Succesfully Beam Back Solar Power From Space
  • 1,020 days Could Crypto Overtake Traditional Investment?
  • 1,025 days Americans Still Quitting Jobs At Record Pace
  • 1,027 days FinTech Startups Tapping VC Money for ‘Immigrant Banking’
  • 1,030 days Is The Dollar Too Strong?
  • 1,030 days Big Tech Disappoints Investors on Earnings Calls
  • 1,031 days Fear And Celebration On Twitter as Musk Takes The Reins
  • 1,033 days China Is Quietly Trying To Distance Itself From Russia
  • 1,033 days Tech and Internet Giants’ Earnings In Focus After Netflix’s Stinker
  • 1,037 days Crypto Investors Won Big In 2021
  • 1,037 days The ‘Metaverse’ Economy Could be Worth $13 Trillion By 2030
  • 1,038 days Food Prices Are Skyrocketing As Putin’s War Persists
  • 1,040 days Pentagon Resignations Illustrate Our ‘Commercial’ Defense Dilemma
  • 1,041 days US Banks Shrug off Nearly $15 Billion In Russian Write-Offs
  • 1,044 days Cannabis Stocks in Holding Pattern Despite Positive Momentum
  • 1,045 days Is Musk A Bastion Of Free Speech Or Will His Absolutist Stance Backfire?
  • 1,045 days Two ETFs That Could Hedge Against Extreme Market Volatility
  • 1,047 days Are NFTs About To Take Over Gaming?
How Millennials Are Reshaping Real Estate

How Millennials Are Reshaping Real Estate

The real estate market is…

What's Behind The Global EV Sales Slowdown?

What's Behind The Global EV Sales Slowdown?

An economic slowdown in many…

Another Retail Giant Bites The Dust

Another Retail Giant Bites The Dust

Forever 21 filed for Chapter…

  1. Home
  2. Markets
  3. Other

Elliott Wave Analysis: SP500; and Crude OIL

S&P500

E-mini S&P500 is moving sideways with a contracting range which is tighter and tighter so breakout is going to occur soon. Technically we expect a push to a new high since we know that triangles are continuation patterns. That said, watch out for 2273 bullish level which can be an important breakout point this week for bulls. On the downside we see 2248 as very important.

S&P500, 1H

S&P500 1-Hour Chart


Crude OIL

Decline on crude oil below 52.66 suggests that rally from Jan 18 low was only a temporary three wave bounce, now labeled as wave E of a bearish triangle. The reason why we changed the view to a temporary bearish mode is also a five wave reversal from 53.67 which means that bears can be in control for a few days. Rise back above 53.67 would be a new bullish evidence for this energy.

Crude OIL, 30Min

Crude Oil 30-Minute Chart


EW-Forecast.com has a special offer available on yearly membership, with 31% OFF.
Visite http://www.ew-forecast.com/service for details


Back to homepage

Leave a comment

Leave a comment