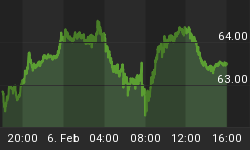
Gold Silver Ratio

One aspect of the precious metals market today that I like is the Gold Silver Ratio. It appears to have topped, right along with the 2016 gold bottom, and for all gold bull followers out there this is certainly a welcomed development. Precious metals bear markets always hit silver hard, while bull markets always see Silver outperform gold. As a result, the Gold Silver Ratio rises during bear markets and then falls during bull markets.
On the chart below, the long rising channel represents the precious metals bear market when gold/silver were both sold aggressively. Each peak in the ratio, as seen with the red arrows, correspond with major Cycle price lows. Meaning that as gold sold and collapsed into each yearly low, Silver as a ratio was hammered further.
But that trend has reversed, and silver has for the first time in five years outperformed gold. The chart shows the Gold Silver Ratio has turned lower, meaning that with the last big gold selloff, Silver actually outperformed gold, on a relative basis. It's not proof of a bear market low, but we do know that every precious metals bull market saw silver dramatically outperform gold. In every case, the Gold Silver ratio turn lower as the entire metals complex went higher. From my perspective, it would appear that the ratio has broken lower and that a new downtrend has been established.

The Financial Tap - Premium
The Financial Tap publishes two member reports per week, a weekly premium report and a midweek market update report. The reports cover the movements and trading opportunities of the Gold, S&P, Oil, $USD, US Bond's Cycles. Along with these reports, members enjoy access to a real-time portfolio with trade alerts.
A significant focus of the reports is to educate traders and investors on the importance of proper trade and risk management, along with understanding the human emotions aspect to trading. We attempt to achieve superior performance in a risk adverse and methodical fashion.
NOTE: It's just $99 for a full 3 months of membership, a fraction of what one stopped out trade is likely to cost you. Consider joining The Financial Tap and receive two reports per week and the education you need to become a better trader or investor See >> SIGN UP PAGE!


