• 395 days Could Crypto Overtake Traditional Investment?
  • 400 days Americans Still Quitting Jobs At Record Pace
  • 402 days FinTech Startups Tapping VC Money for ‘Immigrant Banking’
  • 405 days Is The Dollar Too Strong?
  • 406 days Big Tech Disappoints Investors on Earnings Calls
  • 406 days Fear And Celebration On Twitter as Musk Takes The Reins
  • 408 days China Is Quietly Trying To Distance Itself From Russia
  • 408 days Tech and Internet Giants’ Earnings In Focus After Netflix’s Stinker
  • 412 days Crypto Investors Won Big In 2021
  • 413 days The ‘Metaverse’ Economy Could be Worth $13 Trillion By 2030
  • 413 days Food Prices Are Skyrocketing As Putin’s War Persists
  • 416 days Pentagon Resignations Illustrate Our ‘Commercial’ Defense Dilemma
  • 416 days US Banks Shrug off Nearly $15 Billion In Russian Write-Offs
  • 419 days Cannabis Stocks in Holding Pattern Despite Positive Momentum
  • 420 days Is Musk A Bastion Of Free Speech Or Will His Absolutist Stance Backfire?
  • 420 days Two ETFs That Could Hedge Against Extreme Market Volatility
  • 422 days Are NFTs About To Take Over Gaming?
  • 423 days Europe’s Economy Is On The Brink As Putin’s War Escalates
  • 426 days What’s Causing Inflation In The United States?
  • 427 days Intel Joins Russian Exodus as Chip Shortage Digs In
What's Behind The Global EV Sales Slowdown?

What's Behind The Global EV Sales Slowdown?

An economic slowdown in many…

Billionaires Are Pushing Art To New Limits

Billionaires Are Pushing Art To New Limits

Welcome to Art Basel: The…

How The Ultra-Wealthy Are Using Art To Dodge Taxes

How The Ultra-Wealthy Are Using Art To Dodge Taxes

More freeports open around the…

  1. Home
  2. Markets
  3. Other

Elliott Wave Count Predicts Tuesday's 250 Point DOW Decline, in One Day!

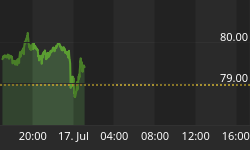
Dow Jones Industrials

Topping in wave (5)


30-min

Dow Industrials 30-Minute Chart
Larger Image


4-Hours

Dow Industrials 4-Hour Chart
Larger Image


Daily

Dow Industrials Daily Chart
Larger Image

My Bias: market top is in.
Wave Structure: Impulsive 5 wave structure, possibly topping in an all time high.
Long term wave count: Topped in wave (5)
Important risk events: USD: Existing Home Sales, Crude Oil Inventories.

After a flat week for the stock market Tuesday's action jolted it back into life!

On Monday night I released my daily analysis and I spoke about the precarious state of the DOW saying

"The DOW has lost its upwards momentum completely, as evidenced by the momentum indicators in both the 30 minute and 4 hr chart.
A bearish downwards cross of the centerline happened again today on the 4hr RSI and MACD.

The wave count off the high is unusual, as we don't often see the wedge pattern, BUT, the rarity could signify the rarity of this moment.
A turning point to remember, so to say."

On Monday night the DOW stood at 20908,
With the wave count looking very bearish and calling for a drop in wave '3' red.
On Tuesday evening the market dropped to 20640,
a 250 point decline in a single day!

This is the power of Elliott wave analysis in action!

From here the downside momentum should continue,
with only intermittent corrective rallies.

The action today is fitting for a third wave, this is usually the longest and strongest wave.
Wave '4' should be a three wave affair, and should complete before resistance at 20777.
The alternate wave count still views the current decline as wave (iv) grey, so this is something to watch out for.
further declines below 20525 should cement the trend change and herald in the bear market.


Back to homepage

Leave a comment

Leave a comment