


AUDUSD
AUDUSD is looking for some support down at 0.7584 to be exact, but after only three waves of decline from 0.7648. We think that was a corrective wave B as part of an irregular correction which means that wave 2) can see higher prices. There is room for 0.7648 resistance to be hit, or maybe even 0.7684 before market may start a new bearish leg.
AUDUSD, 1H

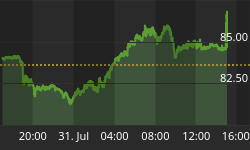
S&P500
Not much of change on E-mini S&P500 intraday chart, where we still see prices in a three-wave advance. It's a recovery that can extend up to 2358 area after wave b/ii is finished, which is now underway. At the same time, I am looking at the RSI divergence line that may indicate a bounce higher into c/iii wave, once upper channel line is tested.
S&P500, 1H

Visit our website and Get more charts and forecasts with free access through 14-Day Trial Offer
You can also follow us on twitter @ewforecast
www.ew-forecast.com


