


USDCHF
On the updated chart of USDCHF, we see price undergoing a nice sharp and strong rally to the upside, probably as an indication for a low in place. If that is the case, then recent big three wave pattern to the downside is completed as a contra-trend move, therefore more gains may follow in days ahead. Now, we see price trading in the first wave 1) that may find a potential top in sessions ahead and make a minimum three wave reversal to the downside for wave two. Possible support can then be around 0.9900.
USDCHF, 4H

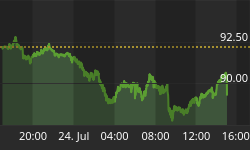
USDJPY
USDJPY is falling sharply for the last few weeks, clearly with impulsive price action down from 115.50, but if we take a look at the whole bearish cycle from December 2016 high, then we need to be aware of a new significant turn. The reason is a three-wave structure, which in Elliott Wave terminology represents a corrective price move, but it's important to wait on a confirmed low of a wave C) before we may turn bullish. With that being said, we would need an impulse back above the swing high of wave 4 to confirm end of a bearish cycle.
USDJPY, 4H

Visit our website and Get more charts and forecasts with free access through 14-Day Trial Offer
You can also follow us on twitter @ewforecast
www.ew-forecast.com


