


Market Summary
Market indexes basically ended the week flat. Last week, the benchmark S&P 500 index fell .03% and the blue-chip DOW Jones Industrial Average ended where it started. The tech-heavy Nasdaq Composite Index logged a .06 weekly decline. The smaller cap Russell 2000 and MidCap 400 indexes are the biggest losers ending down 1.54% and .77% respectively. As seen in the chart below, after the presidential election the major stock indexes bolted higher but have basically been trending in a trading range all year. Conversely precious metals and treasury bonds plunged under the threat of higher interest rates, but recovered a bit the past few weeks as the dollar weakened.

A standard chart that we use to help confirm the overall market trend is the Momentum Factor ETF (MTUM) chart. Momentum Factor ETF is an investment that seeks to track the investment results of an index composed of U.S. large- and mid-capitalization stocks exhibiting relatively higher price momentum. This type of momentum fund is considered a reliable proxy for the overall stock market trend. We prefer to use the Heikin-Ashi format to display the Momentum Factor ETF. Heikin-Ashi candlestick charts are designed to filter out volatility in an effort to better capture the true trend. Recently we have noted "... given the recent behavior of the stock market, now the question appears to be whether the price trend will continue to move sideways or start turning down...the trend continued moving sideways...will the price trend remain neutral or finally break through the top of the trading range..." Stocks prices have stalled a bit but aren't really pulling back very much. Until technical indicators hint otherwise our recent analysis is still valid where we opined "...With and earnings season starting up, the MTUM might be primed for a breakout which signals the next bull leg for the major indexes..." But, there is also the risk that if earnings fail to revive the market's momentum, investors may be forced to play an extended waiting game for the next catalyst.

A tool to help confirm the overall market trend is the Bullish Percent Index (BPI). The Bullish Index is a popular market "breadth" indicator used to gauge the internal strength/weakness of the market. Like many of the technical market internal indicators, it is used both to confirm a move in the market and as a non-confirmation and therefore divergence indication. Nasdaq stocks have been leading the market direction for the past year. Recently we opined "...the BPCOMPQ is beginning a recovery bounce...If the index follows up on its recovery bounce and continues higher, this might be a very strong signal that the other major indexes are set to break higher out of their recent trading ranges..." Basically the Nasdaq is achieving new all-time highs on the back of a narrow group of stocks, primarily the FANG shares. In the updated chart below the BPCOMPQ did not follow through on its recovery bounce and until this happens it will probably remain difficult for the overall market to trend higher.

In the chart below, the dollar continues trying to recover from its five-month low posted in March. A stronger greenback tends to restrain the prices of commodity assets like gold and treasuries which are pegged to the dollar and makes them more expensive to buyers using other monetary units. Gold remains in an uptrend, ending higher five out of the past six trading days. For the week, gold logged its fourth straight weekly advance. Treasury bonds strengthened in the aftermath of the U.S. Navy's attack on Syrian targets, which sent investors scurrying to the safety of government bonds, pushing prices higher and yields firmly lower.

Market Outlook
Jeff Hirsch in the Almanac Trader updated the S&P 500 Performance during the First 100 Days of new administrations since 1953 in a post titled "February Weakness Stolen, March Stolen Thunder." Looking at the chart below March was indeed a dud. Instead of a respectable rally, S&P 500 fell 0.04% in March. It has been 78 calendar days since President Trump took office and S&P 500 has gained 3.9% which is still above historical average. Historically, March was a flat month for new Republican administrations (solid red line in chart below), but that weakness ended on average in early April and the S&P 500 rallied nearly 4% by the end of the month (black arrow). A similar result this year would put S&P 500 off this chart by the end of the month. Recently we pointed out April marks the end of what is historically the best six months for DJIA and the S&P 500. Since 2006, April has been up eleven years in a row with an average gain of 2.6% to reclaim its position as the best DJIA month since 1950. April is second best for S&P and fourth best for NASDAQ (since 1971).

The CBOE Volatility Index (VIX) is known as the market's "fear gauge" because it tracks the expected volatility priced into short-term S&P 500 Index options. When stocks stumble, the uptick in volatility and the demand for index put options tends to drive up the price of options premiums and sends the VIX higher. Recently we pointed out "...as equity prices have faltered a bit the past few weeks' investors are starting to show signs of nervousness by driving the VIX higher..." As evidenced in the updated chart below this trend continues as investors are becoming concerned about the White House fiscal agenda and increasing global restlessness.

The American Association of Individual Investors (AAII) Sentiment Survey measures the percentage of individual investors who are bullish, bearish, and neutral on the stock market for the next six months; individuals are polled from the ranks of the AAII membership on a weekly basis. The current survey result is for the week ending 04/06/2017. Pessimism among individual investors about the short-term direction of stock prices rose to nearly 40%, according to the latest AAII Sentiment Survey. Bearish sentiment, expectations that stock prices will fall over the next six months, rose 2.2 percentage points to 39.6%. The increase keeps pessimism at or above its historical average of 30.5% for the eighth consecutive week and the 11th out of the last 12 weeks. At the same time, optimism fell below 30%. Bullish sentiment, expectations that stock prices will rise over the next six months, fell 1.9 percentage points to 28.3%. This is the 11th time out of the last 12 weeks that optimism is at or below its historical average of 38.5%. This week's results put optimism very close to the bottom of its typical range and pessimism very close to the top of its typical range. A bullish sentiment reading below 28.1% would be unusually low (more than one standard deviation below average.) A bearish sentiment reading above 40.0% would be unusually high (more than one standard deviation above average). Of the two, unusually low bullish sentiment readings have a much stronger record as a contrarian indicator, with the S&P 500 realizing a median gain of 6.3% over the following six-month periods. Neutral sentiment, expectations that stock prices will stay essentially unchanged over the next six months, declined 0.3 percentage points to 32.1%. The historical average is 31.0%.

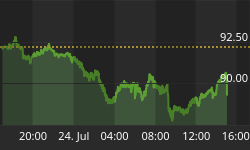
The National Association of Active Investment Managers (NAAIM) Exposure Index represents the average exposure to US Equity markets reported by NAAIM members. The blue bars depict a two-week moving average of the NAAIM managers' responses. As the name indicates, the NAAIM Exposure Index provides insight into the actual adjustments active risk managers have made to client accounts over the past two weeks. The current survey result is for the week ending 04/05/2017. First-quarter NAAIM exposure index averaged 92.85%. Last week the NAAIM exposure index was 68.95 %, and the current week's exposure is 67.47%. Money managers are holding on waiting for some strong economic data before bidding equity prices higher. The good news is the institutional investors are refusing a wholesale selloff despite opportunities to do so. Volatility is creeping higher, but strong quarterly earnings reports or perceived progress on some of the proposed tax cut related legislation out of Washington could ignite investors to rotate money back into equities driving the NAAIM Exposure Index higher.

Trading Strategy
A recent American Association of Individual Investor (AAII) survey how the potential impact that President Trump could have on the domestic and global economy continues to cause uncertainty or concern among some investors, while encouraging others. They indicated the prevailing level of valuations and the lack of downside volatility have increased concern about the potential for a forthcoming drop in stock prices. The AAII asked members to explain how the success or failure of the Trump administration's proposed policies influence their outlook for stock prices. Responses were mixed. Nearly one out of four respondents (24%) think the president's policies will have a positive impact, particularly those policies that go beyond health care (tax reform, deregulation, etc.). Conversely, nearly 22% think Washington politics could have a negative impact on the market either by allowing his proposals to move forward or by having the proposals snagged in gridlock or otherwise not passed. An additional 11% say President Trump is causing them to be more cautious, with some of these respondents describing him as being too unpredictable. About 19% say the president is not influencing or otherwise factoring into their outlook. Some of these respondents described his rhetoric as just being noise, while others say they are more focused on fundamental factors. Fewer than 8% say that it is still too early to tell what impact the administration's policies will have on the market. And last week we mentioned how "...Much of the market momentum since Election Day has been due to hopes that a new administration would enact policies favorable to the corporate environment and spur economic growth..." Our recently analysis is still in play where we said "...uncertainty among traders – they are not willing to sell off equities, but not quite ready to commit to bidding prices higher. Also there is some sector rotation going which usually happens after a quarterly close and investors are waiting to see what earnings season looks like. In the current trading environment market neutral and short term directional trades have been profitable for us..." Of particular note in the current chart below is that S&P Financial sector stocks crashing over concerns about the timing of future rate cuts.

Feel free to contact me with questions,


