


Market Summary
Market indexes ended the week on a down note. Last week, the benchmark S&P 500 index and the blue-chip DOW Jones Industrial Average fell 1.21% and 1.01% respectively. The tech-heavy Nasdaq Composite Index logged a 1.26% weekly decline. The smaller cap Russell 2000 and MidCap 400 indexes are the biggest losers ending down 1.41% and 1.58% respectively. As seen in the chart below, the major stock indexes have been confined in a tight trading range the past few months. Gold and treasury bonds are moving up fast as investors have returned to "risk-off" trading.

A standard chart that we use to help confirm the overall market trend is the Momentum Factor ETF (MTUM) chart. Momentum Factor ETF is an investment that seeks to track the investment results of an index composed of U.S. large- and mid-capitalization stocks exhibiting relatively higher price momentum. This type of momentum fund is considered a reliable proxy for the overall stock market trend. We prefer to use the Heikin-Ashi format to display the Momentum Factor ETF. Heikin-Ashi candlestick charts are designed to filter out volatility in an effort to better capture the true trend. Recently we have been saying "... given the recent behavior of the stock market, now the question appears to be whether the price trend will continue to move sideways or start turning down...the trend continued moving sideways... Stocks prices have stalled a bit but aren't really pulling back very much..." In the updated chart below the Momentum Factor ETF remains stuck in an almost two-month long trading range. Eventually there will be a breakout, but the question is will it be an upside or downside break?

A tool to help confirm the overall market trend is the Bullish Percent Index (BPI). The Bullish Index is a popular market "breadth" indicator used to gauge the internal strength/weakness of the market. Like many of the technical market internal indicators, it is used both to confirm a move in the market and as a non-confirmation and therefore divergence indication. Nasdaq stocks have been leading the market direction for the past year. Our recent analysis is playing out as advertised "...Basically the Nasdaq is achieving new all-time highs on the back of a narrow group of stocks, primarily the FANG shares...the BPCOMPQ did not follow through on its recovery bounce and until this happens it will probably remain difficult for the overall market to trend higher..." In the updated chart below the Nasdaq Composite Bullish Index ($BPCOMPQ) continues to break down, until we get a confirmed recovery bounce the overall stock market will probably continue trending sideways.

The U.S. dollar fell against its major rivals on last week after a pair of weak datapoints raised new questions about the strength of the economy. The buck was on track for a weekly decline, though trading was anemic with market participants mostly out in observance of Good Friday. The equity market was closed, as was the bond and commodities markets. Gold prices eased from five-month highs last as the dollar rebounded from a slide triggered by comments from U.S. President Donald Trump that the greenback was too strong and that he would prefer the Federal Reserve keep interest rates low. The metal was up about 2.6 percent on the week, on track for its biggest weekly gain since June, as concerns over tensions in North Korea and the Middle East kept stock markets under pressure. Treasuries advanced last week as geopolitical jitters and comments by President Donald Trump continued to fuel a bid for government bonds. Investors took advantage of the temporary weakness in the U.S. currency to pile into Treasuries, market participants said.

Market Outlook
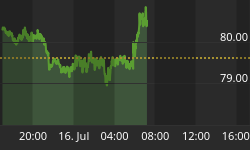
An article by William Watts published in MarketWatch talked about how U.S. stocks, while looking shaky, haven't seen an outright plunge. And other assets generally perceived as risky, including high-yield corporate debt and emerging market equities and bonds have held their own. Kathleen Brooks, research director at City Index in London, argued that the phenomenon suggest the S&P 500 which on Wednesday closed below its 50-day moving average for the first time since November, isn't having its usual impact on other asset prices. In a Wednesday note, she observed that the correlation between the benchmark stock index and other assets has weakened significantly since the beginning of the year. "The fact that this is not happening suggests a couple of things: firstly, we are not in a period of market panic, and secondly, that any selloff in some risky assets such as U.S. stocks could be mild and may not signal contagion to other asset classes," she wrote. Brooks said the breakdown in correlations between the S&P 500 and other asset classes could mean that a jump by the VIX, which measures expectations for volatility over the coming 30 day period based on S&P 500 options, isn't such a great gauge of fear on Wall Street and that a dip by the S&P 500 won't necessarily translate into weakness for other asset classes. You can see in the chart below how gold has returned as the top performing asset. Investors are getting more nervous about global uncertainty converting to "risk-off" asset classes for protection.

The CBOE Volatility Index (VIX) is known as the market's "fear gauge" because it tracks the expected volatility priced into short-term S&P 500 Index options. When stocks stumble, the uptick in volatility and the demand for index put options tends to drive up the price of options premiums and sends the VIX higher. As we recently pointed out "...as equity prices have faltered a bit the past few weeks' investors are starting to show signs of nervousness by driving the VIX higher..." In the updated chart below the Volatility Index is at the highest level since last November. Investors have gotten nervous heading into quarterly earnings season and are putting hedges in place as protection.

The American Association of Individual Investors (AAII) Sentiment Survey measures the percentage of individual investors who are bullish, bearish, and neutral on the stock market for the next six months; individuals are polled from the ranks of the AAII membership on a weekly basis. The current survey result is for the week ending 04/12/2017. The percentage of individual investors expecting stocks to rise in price is below 30% for a second consecutive week. Bullish sentiment, expectations that stock prices will rise over the next six months, is modestly higher (0.7 percentage points) at 29.0%. Prior to this month, optimism had not been below 30% since last November's election. This week is also the 12th out of the last 13 with optimism below its historical average of 38.5%. The latest AAII Sentiment Survey also shows a rise in neutral sentiment and a decline in pessimism. Neutral sentiment, expectations that stock prices will stay essentially unchanged over the next six months, rose 1.6 percentage points to 33.6%. The rise keeps neutral sentiment above its historical average of 31% for the fourth consecutive week.
Bearish sentiment, expectations that stock prices will fall over the next six months, pulled back by 2.2 percentage points to 37.4%. Even with the decline, pessimism remains at or above its historical average of 30.5% for the ninth consecutive week and the 12th out of the last 13 weeks. The current streak of consecutive weeks with bearish sentiment at or above its historical average is the longest such streak in nearly five years. Pessimism stayed above its historical average for 15 consecutive weeks between August 30 and December 6, 2012.

The National Association of Active Investment Managers (NAAIM) Exposure Index represents the average exposure to US Equity markets reported by NAAIM members. The blue bars depict a two-week moving average of the NAAIM managers' responses. As the name indicates, the NAAIM Exposure Index provides insight into the actual adjustments active risk managers have made to client accounts over the past two weeks. The current survey result is for the week ending 04/12/2017. First-quarter NAAIM exposure index averaged 92.85%. Last week the NAAIM exposure index was 67.47 %, and the current week's exposure is 86.70%. Last week we opined "...Money managers are holding on waiting for some strong economic data before bidding equity prices higher. The good news is the institutional investors are refusing a wholesale selloff despite opportunities to do so. Volatility is creeping higher, but strong quarterly earnings reports...could ignite investors to rotate money back into equities driving the NAAIM Exposure Index higher..." Banks kicked off earning season last week with particularly strong results from investment banking. Overall banks announced positive results and future performance is expected to benefit from higher interest rates.

Trading Strategy
A recent American Association of Individual Investor (AAII) survey asked investors if the potential impact that President Trump could have on the domestic and global economy continues to cause uncertainty and/or concern among some individual investors, while encouraging others. At the same time, prevailing valuations and the lack of downside volatility have increased concern about the potential for a forthcoming drop in stock prices. Asked they adjusted their stock investing strategies recently. Responses were very mixed. The largest group, 22% of all respondents, said that they have not made any change. Approximately 21% said that they've sold stocks and boosted their cash positions. Some of these respondents expressed concerns about the potential for a drop in stock prices or geopolitical turmoil. Nearly 11% are seeking yield, either via dividend-paying stocks or real estate investment trusts (REITs). Almost 9% favor value, while 6% expressed a preference for large-cap stocks. Last week we mentioned how "...uncertainty among traders – they are not willing to sell off equities, but not quite ready to commit to bidding prices higher... In the current trading environment market neutral and short term directional trades have been profitable for us... S&P Financial sector stocks crashing over concerns about the timing of future rate cuts..." Tight stops should be the top priority given the persistent downside price pressure on the overall stock market.

Feel free to contact me with questions,


