


The good news is:
• Most of the major averages, even the XAU hit multi year highs againthis week.
Short term
NASDAQ new highs for this year, so far, peaked at 232 on Monday and fell to 102 on Friday.
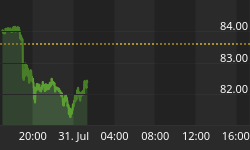
The NASDAQ new high indicator (OTC NH) is a 10% trend (19 day EMA) of NASDAQ new highs. The chart below covers the period from mid July last year through last Friday. Vertical dashed lines are drawn on the 1st trading day of each month. The NASDAQ composite (OTC) is shown in red and OTC NH is shown in green.
The indicator does a pretty good job of ironing out the minor wiggles in prices. It turned down Friday, a modestly up day for the index.
Thursday was a down day for the index and the indicator moved upward with 151 reported new highs while Friday was a modest up day (OTC up 0.02%) and the indicator moved downward with 102 reported new highs.
As of Friday the value of the indicator was 128 so more than 128 new highs will move the indicator upward while less than 128 will move the indicator downward.

Intermediate term
Many of the major indices hit multiyear highs on Wednesday ending a run of 7 consecutive up days. Periods of 7 consecutive up days are relatively rare. Measured by the Wilshire 5000 (Wil-5) the market has had 3 periods of 7 consecutive up days in the past year.
In May of 1996 the Wil-5 moved up for over 7 consecutive days and that blow-off marked the high for the next 5 months. Since then each period of 7 consecutive up days has been followed by a modest pull back lasting 1 day to 6 weeks followed by higher highs.
The chart below shows the past year with the Wil-5 in red and an indicator showing the percentage of the previous 7 trading days that have been up in blue.

Seasonality
Options expire on the 3rd Friday of each month. For about 10 years beginning in the mid 1980's perceived higher levels of volatility were blamed on options expiration. The tables below show the week prior the 3rd Friday of January during the 2nd year of the Presidential cycle. The tables cover years 1966 - 2002 for the OTC and 1930 - 2002 for the S&P 500 (SPX). There are summaries for all years 1963 - 2005 for the OTC and 1928 - 2005 for the SPX. Options were not actively traded before the early 1980's.
The week prior to the 3rd Friday has on average been pretty strong. Since 1963, as measured by the OTC it has been up 80% of the time.
There will be no trading on Monday in observance of the Martin Luther King holiday. The holiday was first observed in 1986, however, the market did not close for the holiday until 1998 so there is very little history from which to determine if the holiday has an effect on the market.
Report for the week before options expiration Friday during January.
The number following the year is the position in the presidential cycle.
Daily returns from Monday through Friday.
| OTC Presidential Year 2 | ||||||
| Year | Mon | Tue | Wed | Thur | Fri | Totals |
| 1966-2 | 0.56% | 0.31% | -0.03% | 0.41% | 0.41% | 1.65% |
| 1970-2 | 0.01% | 0.65% | 0.30% | -0.27% | -0.02% | 0.67% |
| 1974-2 | 0.18% | 0.73% | 1.53% | 1.55% | -0.66% | 3.32% |
| 1978-2 | -0.41% | 0.62% | 0.44% | 0.16% | 0.05% | 0.86% |
| 1982-2 | 0.00% | -0.62% | -0.24% | 0.37% | -0.31% | -0.80% |
| Avg | 0.09% | 0.34% | 0.40% | 0.44% | -0.11% | 1.14% |
| 1986-2 | 0.02% | 0.19% | 1.05% | 0.58% | 0.19% | 2.02% |
| 1990-2 | -0.70% | 0.81% | -0.34% | -0.26% | 0.77% | 0.27% |
| 1994-2 | -0.02% | 0.11% | -0.47% | 0.48% | 0.16% | 0.25% |
| 1998-2 | 0.29% | 2.26% | 0.43% | -0.07% | 1.02% | 3.93% |
| 2002-2 | -1.57% | 0.51% | -2.82% | 2.13% | -2.79% | -4.55% |
| Avg | -0.40% | 0.77% | -0.43% | 0.57% | -0.13% | 0.38% |
| OTC summary for Presidential Year 2 1966 - 2002 | ||||||
| Avg | -0.18% | 0.56% | -0.02% | 0.51% | -0.12% | 0.76% |
| Win% | 56% | 90% | 50% | 70% | 60% | 80% |
| OTC summary for all years 1963 - 2005 | ||||||
| Avg | 0.07% | 0.03% | 0.20% | 0.40% | 0.28% | 0.97% |
| Win% | 56% | 36% | 64% | 82% | 82% | 82% |
| SPX Presidential Year 2 | ||||||
| Year | Mon | Tue | Wed | Thur | Fri | Totals |
| 1930-2 | 0.33% | 0.19% | 0.42% | -0.69% | -0.88% | -0.65% |
| 1934-2 | 5.77% | 0.47% | -0.28% | -0.28% | 2.82% | 8.50% |
| 1938-2 | -2.02% | -1.03% | -0.87% | 1.83% | -1.89% | -3.96% |
| 1942-2 | 0.57% | 2.04% | 0.00% | 0.22% | -0.88% | 1.94% |
| 1946-2 | 1.50% | 0.16% | 0.11% | -0.22% | -0.22% | 1.33% |
| 1950-2 | 0.42% | 0.84% | -0.06% | 0.12% | 0.18% | 1.49% |
| 1954-2 | 0.00% | 0.98% | 0.27% | 0.16% | 0.23% | 1.64% |
| 1958-2 | 0.30% | 0.44% | 0.79% | 0.17% | 0.10% | 1.80% |
| 1962-2 | -0.20% | -0.58% | -1.09% | 0.10% | 0.53% | -1.23% |
| Avg | 0.50% | 0.37% | 0.00% | 0.07% | 0.16% | 1.01% |
| 1966-2 | 0.29% | 0.19% | -0.28% | -0.35% | 0.12% | -0.03% |
| 1970-2 | -0.76% | 0.10% | -0.15% | 0.03% | -0.83% | -1.61% |
| 1974-2 | -0.26% | 0.87% | 1.53% | 1.70% | -1.79% | 2.05% |
| 1978-2 | -0.29% | 0.50% | 0.76% | -0.52% | -0.22% | 0.23% |
| 1982-2 | 1.64% | -1.07% | -0.60% | 0.42% | -0.32% | 0.07% |
| Avg | 0.12% | 0.12% | 0.25% | 0.26% | -0.61% | 0.14% |
| 1986-2 | 0.37% | -0.04% | 0.78% | 0.44% | -0.35% | 1.20% |
| 1990-2 | -0.86% | 1.11% | -0.98% | 0.23% | 0.28% | -0.21% |
| 1994-2 | -0.34% | 0.20% | 0.01% | 0.14% | -0.05% | -0.04% |
| 1998-2 | 1.24% | 1.38% | 0.61% | -0.75% | 1.13% | 3.61% |
| 2002-2 | -0.63% | 0.68% | -1.62% | 1.00% | -0.99% | -1.56% |
| Avg | -0.04% | 0.67% | -0.24% | 0.21% | 0.00% | 0.60% |
| SPX summary for Presidential year 2 1930 - 2002 | ||||||
| Avg | 0.39% | 0.39% | -0.04% | 0.20% | -0.16% | 0.77% |
| Win% | 56% | 79% | 50% | 68% | 42% | 58% |
| SPX summary for all years 1928 - 2005 | ||||||
| Avg | -0.05% | 0.05% | 0.08% | 0.11% | -0.07% | 0.12% |
| Win% | 46% | 56% | 59% | 61% | 50% | 58% |
Conclusion
The market is overbought and OTC NH has turned downward, but seasonally next week has been strong.
I expect the major indices to be lower on Friday January 20 than they were on Friday January 13.
Last weeks negative forecast was a miss. Most of the major indices were modestly up (DJIA up 0.01%).
This report is free to anyone who wants it, so please tell your friends. They can sign up at: http://alphaim.net/signup.html. If it is not for you, reply with REMOVE in the subject line.


