• 657 days Will The ECB Continue To Hike Rates?
  • 657 days Forbes: Aramco Remains Largest Company In The Middle East
  • 659 days Caltech Scientists Succesfully Beam Back Solar Power From Space
  • 1,059 days Could Crypto Overtake Traditional Investment?
  • 1,064 days Americans Still Quitting Jobs At Record Pace
  • 1,066 days FinTech Startups Tapping VC Money for ‘Immigrant Banking’
  • 1,069 days Is The Dollar Too Strong?
  • 1,069 days Big Tech Disappoints Investors on Earnings Calls
  • 1,070 days Fear And Celebration On Twitter as Musk Takes The Reins
  • 1,072 days China Is Quietly Trying To Distance Itself From Russia
  • 1,072 days Tech and Internet Giants’ Earnings In Focus After Netflix’s Stinker
  • 1,076 days Crypto Investors Won Big In 2021
  • 1,076 days The ‘Metaverse’ Economy Could be Worth $13 Trillion By 2030
  • 1,077 days Food Prices Are Skyrocketing As Putin’s War Persists
  • 1,079 days Pentagon Resignations Illustrate Our ‘Commercial’ Defense Dilemma
  • 1,080 days US Banks Shrug off Nearly $15 Billion In Russian Write-Offs
  • 1,083 days Cannabis Stocks in Holding Pattern Despite Positive Momentum
  • 1,084 days Is Musk A Bastion Of Free Speech Or Will His Absolutist Stance Backfire?
  • 1,084 days Two ETFs That Could Hedge Against Extreme Market Volatility
  • 1,086 days Are NFTs About To Take Over Gaming?
Is The Bull Market On Its Last Legs?

Is The Bull Market On Its Last Legs?

This aging bull market may…

How Millennials Are Reshaping Real Estate

How Millennials Are Reshaping Real Estate

The real estate market is…

Strong U.S. Dollar Weighs On Blue Chip Earnings

Strong U.S. Dollar Weighs On Blue Chip Earnings

Earnings season is well underway,…

  1. Home
  2. Markets
  3. Other

Investors Rude Awakening

US elections were 6 months ago. The first 100 days of Trump's administration ended on April 29th. Markets have been in pause for 2 months.

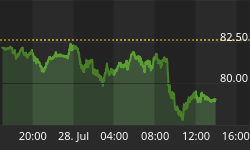
If we look at the chart of the Dow below, we see that stock investors were rewarded with very fast returns between November and March.

Dow Industrials Weekly Chart

However, does the calm we have seen in US stocks since early March and the obsession with Dow 21,000 reveal the financial realities shown?

US created only 98,000 jobs in March, vs 180,000 expected, CNBC, April 7 '17
U.S. GDP Growth (O.7%) Slowed on Tepid Consumer Spending, WSJ, April 28 '17
Retail Apocalypse: Everything You Need To Know, Visual Capitalist, April 28 '17
Trump slaps first tariffs on Canadian lumber, CNN Money, April 25 '17

S&P500 versus Citi Macro Surprise Index

Algorithms and constant aid by central bankers have given millions of investors and advisors the view that ignoring "negative" financial and geopolitical headlines is wise, and that none of this information need be considered any longer when looking off the top of the largest asset/debt bubble in history. Besides, if we see stocks cut in half again like 2008, the central banks can merely print up trillions in debt again to artificially inflate assets...right?

Click here to join the ongoing commentary from The Investor's Mind. This clock is running down. The amount of history making patterns grows with each month. Are you watching for the big switch? What action will you take when this boom turns to bust? I can't think of a better time to join the readers of The Investor's Mind.

Remember, the greater the assistance to keep markets looking calm, the more powerful the return to reality when it arrives.


Back to homepage

Leave a comment

Leave a comment