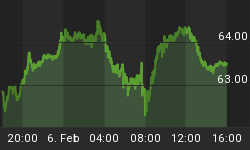
A Broadening Top, a.k.a. Megaphone pattern has emerged, calling for Bonds to tank over the intermediate term. A wave 1 bottom will arrive after the final Minuette wave v down. Once Minor Degree wave 2 up corrects the recent decline, a Bearish Head & Shoulders pattern warns a wave 3 down should hurt Bondholders - about the time the Fed stops reporting M-3 in March/April. Perhaps how it will go is, demand for U.S. Dollars (to buy oil) will decline once Iran opens its euro-based oil bourse in March. With too much supply, the Dollar collapses. A collapsing Dollar is tantamount to rising inflation, which should put pressure on Bonds. The Fed may need to monetize this debt, i.e., be the buyer, to support Bond prices, hence the need to hide the only tool at their disposal to accomplish this - M-3.


The Treasury Yield Curve this week is a normal upward sloping curve from the 2 year out to the 20 year, however, from the 2 year to the 10 year is flat on January 20th, 2006. There was very little change from last week.
The U.S. Dollar completed its second wave A up and second B down of a Double Flat/Zigzag corrective intermediate-term rally. The final wave C to a corrective Primary wave (2) top is next.
We can estimate the timing of the start of the Dollar's coming collapse into the 60s (probably even lower) by doubling the time the first A-B-C (a Flat 3-3-5 pattern) took for corrective Primary degree wave (2) up. From the time the U.S. Dollar's Primary (1) bottomed on December 31st at 80.39, to the time the first of what will be two A-B-C patterns topped at C on July 8th at 90.77, was about seven months. Then the dividing wave, X, took the Dollar down to 86.02 on September 2nd. That timing says the start of the decline should arrive coincident with the March/April period when M-3 is hidden and Iran starts selling oil on its bourse in euros.
A Free 30 day Trial Subscription gains you access to our Guest Articles section where we recently posted a fascinating piece, The Approaching War With Iran, by Edward F. Haas.

If you would like a Free 30 day Trial Subscription to check out our remarkable buy/sell signals on the blue chip Dow Industrials and S&P 500, NASDAQ 100, or HUI Amex Gold Bugs Index, simply go to www.technicalindicatorindex.com, and click on the "Contact Us" button, and email us with your request, including a password you would prefer to use to access our site. A subscription gains you access to index buy/sell signals, our thrice weekly Market Analysis Newsletters, Traders Corner, Guest Articles, and our Archives. On October 13th, 2005 we closed out our latest Trader's Corner transaction with a 51.8 percent profit over a 21 trading day period (this is not an annualized figure). The prior trade garnered a 34 percent profit.
"Let no one in any way deceive you, for {the day of the Lord}
will not come unless the apostasy comes first,
and the man of lawlessness is revealed, the son of destruction,
who opposes and exalts himself above every so-called god
or object of worship, so that he takes his seat in the
temple of God, displaying himself as being God.
And you know what restrains him now,
so that in his time he may be revealed.
For the mystery of lawlessness is already at work;
only He who now restrains will do so until He is taken out of the way.
And then that lawless one will be revealed
whom the Lord will slay with the breath of His mouth
and bring to an end by the appearance of His coming."
2nd Thessalonians 2: 3-4, 6-8


