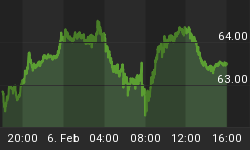
It has been a glowing season for the gold price. The yellow metal has risen to vertiginous heights, most recently reaching near the $570 level, a high not seen since 1981. Meanwhile, the dollar index has pulled back from its recent rally high but continues to be a source of bafflement for many as the inverse correlation with gold it formerly enjoyed has apparently become uncoupled.
First, a short-term technical observation on gold. You may have noticed that gold broke out above the upper boundary of its parallel uptrend channel last week. This effort (an upside "channel buster") may have temporarily exhausted the market and it wouldn't be at all surprising to see gold pulling back inside the channel for a period of consolidation/correction. That, plus the fact that the spot gold index has pulled too far away from its 200-day moving average. In other words, it's time to expect a correction for our friend the yellow metal.

Turning our attention to the dollar, why has the formerly inverse relationship that gold and the dollar enjoyed for so long fallen apart in the past several months? As pointed out recently by analyst Mark Dodson, the collapse of the inverse correlation between gold and the dollar has in large measure been a function of Exchange Traded Fund demand for physical gold. Dodson points out that according to data released by the World Gold Council, over 75% in the growth in demand for gold in the third quarter of 2005 came from gold ETFs. For instance, the popular streetTracks gold ETF (GLD), the fastest growing ETF in U.S. history, according to Dodson has to actually hold the bullion (289 tons worth).
A reader writes, "I was thinking of using the following strategy for a small portion of my portfolio. Since I have never done this before, I amcurious what insights you may have regarding this strategy?
"1. Buy the top five performing juniors year to date. Perhaps 2K per company. Place stop loss at 5%. Using a trailing stop may be advantageous too.
"2. Sell any company that drops off the list and buy next performer. You could also hold the position and sell only if company falls below a specific percentage. If company falls below 5% and triggers stop loss, buy next performer. Use low commission online broker.
"3. Collect half of profit when stock doubles or hold position.
"At the end of the year, you should have performers that performed like last years top five below:
Norsemont 867.0%
US Gold 721.4%
Crested Corp 589.2% Tan Range 532.1%
Silver Corp 503.4%"
This strategy sounds like an effective one to use in a momentum-driven market. I've always advocated trading mainly among the gold shares that consistently make new 10-week highs on a rolling basis since these are the ones with momentum behind them and are therefore likely to continue to move higher. But the reverse of this is that when momentum peaks, the big performers are the ones most likely to get hit the hardest in percentage terms. Also, a 5% stop-loss may work well in some market and for some stocks, but not others. This is particularly true of lower-priced volatility stocks. I believe Edwards & Magee advocated placing stops 5% below the last established minor bottom; or in the case of more sensitive lower-priced stocks, 7 ½% below the last bottom.


