I am not trying to be a wise guy with the first half of the title (it’s a goof on alarmist media), but if you were not bear biased or outright bearish on the gold sector’s daily and weekly technicals, and its macro and sector fundamentals by now all you have left are the alarmist headlines now telling us about H&S breakdowns, HUI/Gold ratio bearishness and whatever else is going on out there in media large and small to scare the lowly gold bug.
As noted in an NFTRH update last night…
It’s hard to feel bullish now and that is the point of markets. Sometimes you have to do what is hard. Let’s remember that we’d planned for the sector to bottom out in December or January all along and it is only dutifully working to that script. The time for caution was back when HUI topped out at 220, and extreme caution when it lost key support at 195-200. Now the sector is on a plunge that could be the final act of this correction. Either be thinking brave or be sidelines (or both, laying in wait).
I’ve held the items I’d decided to hold despite a bearish orientation (many individual items are far from the outright tanking status of HUI and the mining ETFs). Personally, I believe it is time to be thinking like a predator, not a victim.
Here is what last weekend’s NFTRH 476 had to say about the version of the chart (below) we use in the weekly report. We delineate “bounce” vs. “rally” in that a bounce is terminal and only to be played by nimble traders; a rally would be something that the rest of us can make some $$$ on.
Daily HUI has been a pain in the ass. That’s the best way I can describe it. The would-be bounce has simply not gotten underway, although it has not broken down either.
We have noted that a ‘bounce’ would be capped at the 195-200 area, but with the upcoming seasonal (and tax loss dynamics) in mind maybe the general sector is building up pressure for something better than a modest bounce scenario.
Again, I want to stress that I am not bullish because neither the fundamentals nor the technicals instruct that way. So whether or not it [a bounce] generates the aspect I like best about current positioning is the theoretical “counterbalance” service it provides [to other holdings].
That said, HUI has been testing short-term support for a month now and often the more tests the higher the likelihood that support will give way (it works the other way when an index or stock are banging upward against resistance). So let’s also keep in mind that a trap door could open for a final flush before a rally gets going.
See the 3 ugly red candles this week? Open sesame, trap door! The chart has guided the short-term process since the big bounce last summer. As fundamentals started to degenerate and price started to decline, the caution grew with the final straw being the loss of the key 195-200 support area back in October.
You have not seen me (a guy who wants to be bullish on gold and gold stocks because a real bull market would likely come with an end to the macro casino atmosphere cooked up by Bernanke and his global CB cohorts) writing much about the sector here at the site because it was bearish and I don’t micro manage out of dogma (or agenda).
You do see me writing more now that we are in flush mode because well, that is my thing as a bottom feeder. Also, this is a positive because emotions will start flying now and just maybe the suspect CoT will get fixed as well if there is big time short covering going on by commercial traders and puking by speculators.
As noted so many times over the years you buy the outright regurgitation in this sector; the pain and misery. If you’re holding anything now (I am, lightly) you… to quote Platoon’s Sgt. Barnes “take the pain!” or get out. If you’re watching greedily (I am) you are now thinking like a predator.
However, the play is that technicals would lead fundamentals because unlike the great buying opportunity in Q4 2008, the fundamentals stink. I remember catching falling knives at HUI 250, getting my hands severed, growing new ones and catching more at HUI 150. The reason I was so zealous then? Amid macro destruction the fundamentals (like gold vs. stocks and commodities, and a ramping yield curve) were screaming B.U.Y.!!! Alas, we don’t have that now.
NFTRH 476 went on (charts below are updated versions of those used in #476)…
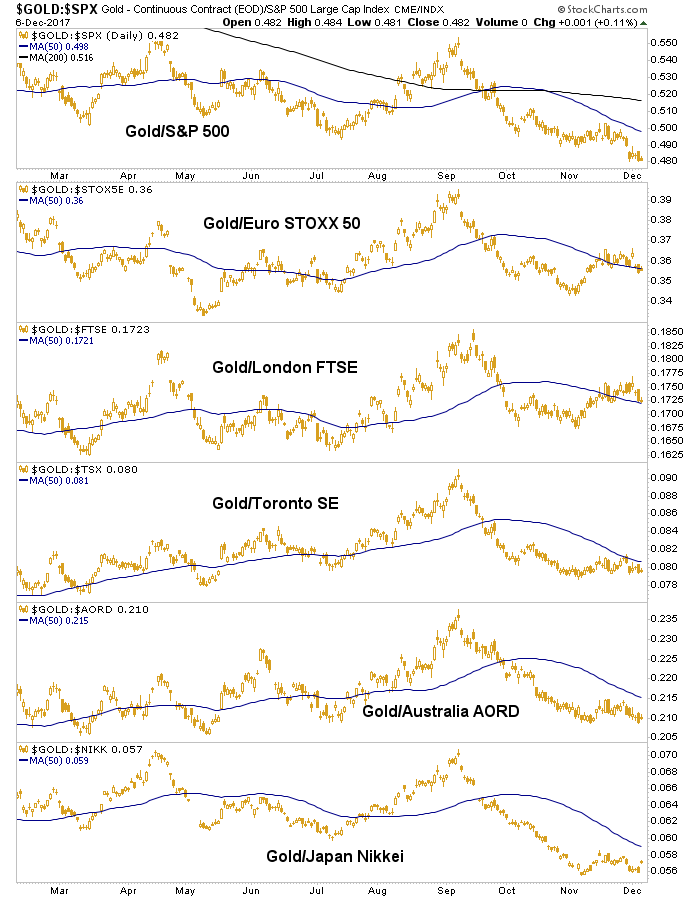
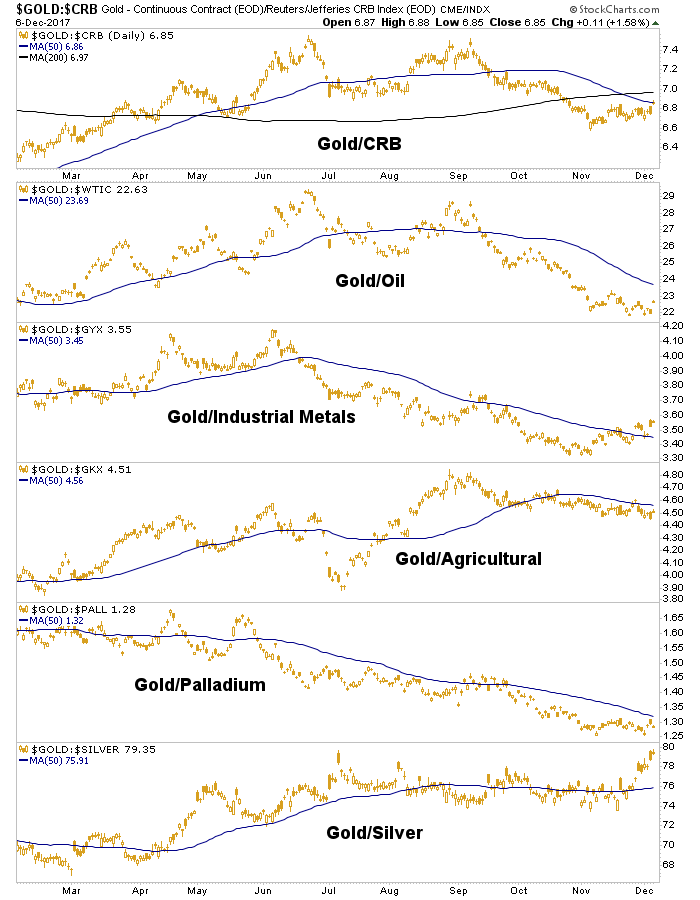
Below are the daily charts of macro and sector fundamentals indicated by gold’s ratios to other assets and markets.
Gold/Stocks is a macro fundamental as it is a barometer of confidence of the average investor. Quite plainly, when the average investor is comfortable, he is not buying gold and its no-income value proposition. He is speculating in a world full of risk on areas.
Gold/Commodities provides even more signals. It can signal an inflationary phase (gold dropping vs. CRB) or deflation/contraction (rising). It can signal investor economic confidence or lack thereof (because like stocks, commodities tend to be cyclical) and finally and importantly, Au/Commodities can signal gold sector fundamentals (like gold/oil, gold/materials, etc.) that feed or detract from gold miners’ bottom lines.
This [gold vs. stocks] is just plain bearish. Of course the caveat to going all perma bear is that at lows these ratios are always going to look bad. The only people looking at gold with interest right now are domiciled in Britain and Europe. That is hyperbole, but for the sake of the chart you get my point. In the gold sector, the real buys come amid destruction and desolation. These ratios show that to be in process. On the bigger picture, recall that our SPX/Au and World/Au stock market charts appear to have further to climb.
Gold has been weak vs. CRB because gold has been weak vs. crude oil, which drives CRB. That is a sector fundamental negative. Period. The balance of these charts shows risk ‘on’, healthy economic signals although potentially, an inflation issue brewing. But for that to become more apparent silver is going to have get the Gold/Silver ratio (GSR) back in line. So far, it’s the classic tale of the GSR pressuring only the precious metals and some commodities. [update 12.6.17: with Au/GYX now lurching bullish we may have a negative signal on the macro developing and this bears close watching, along with the GSR, which is getting downright aggressive].
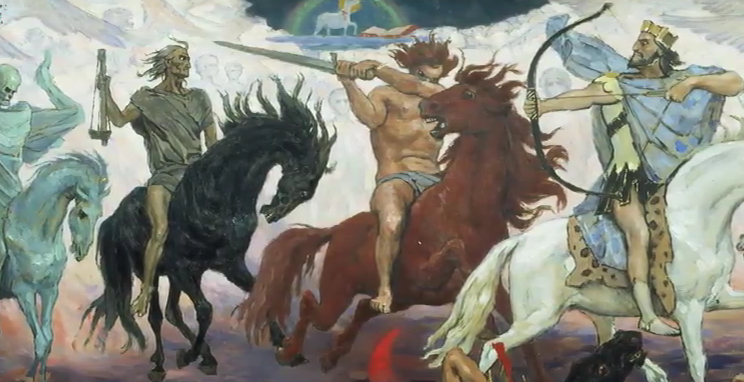
The Gold/Silver ratio is after all, the 4th Horseman. If he rides now it could signal that the 3 Amigos are indeed headed for the tequila bar and their unfulfilled targets would see them morph into Horsemen 1-3 sooner than expected.
I know I am getting a little confusing now with the imagery, so to boil it down, the Amigos are 10 & 30yr Treasury yields, gold vs. stocks and the yield curve. We’re looking for Amigo 1 to be limited at 2.9% & 3.3%, Amigo 2 to retrace 38% of the post-2000 stock market decline vs. gold and the yield curve to bottom near or at flat, or to invert. But the thing is, those are nice, neat, logical levels and what about the global macro market is logical after nearly a decade of unconventional policy injection, after all?
So we continue to carry and favor the intermediate-term happy-go-lucky Amigos theme but if the 4th Horseman joins in and the Amigos don’t reach their destinations, the theme is going to be anything but happy-go-lucky. Call it doom and gloom or hype if you’d like, but I am illustrating the story the indicators are telling.
Now, can anyone tell me how a post about HUI morphed into this far reaching exploration? Maybe it’s all connected. I’ve heretofore been leaning more to happy-go-lucky for the macro pending any corrective activity, but the Gold/Silver ratio brings darker possibilities if it gets out of hand to the upside and stays up there. Meanwhile, the gold miners are tanking on cue and there seems to be a logical rhythm out there somewhere. Now we just have to figure out its true nature and go with it. Simple it’s not, but interesting it definitely is.
By Gary Tanashian


