Ever since we broke down below the upper support region back in early September, and invalidated an immediate break-out set up, we have been looking for the GDX to test the 21 region. It was a point of support which could complete the larger degree wave ii, and begin the long-awaited start to a major 3rd wave rally. And, if it broke, it opened the door to the 17-19 region for a larger degree wave ii bottom.
In early December, we identified the more specific 20.89-21.26 support region, which, if held, could begin that major 3rd wave. But, since it would mean that this 2nd wave would have completed in an unorthodox manner, I noted that I would need to see confirmation that the market has truly bottomed.
As we now know with the benefit of hindsight, the GDX bottomed at 21.27 (within a penny of our support), and began a rally which came within pennies of our first resistance region of 22.30 before it pulled back. Last weekend, I noted that the market was likely set up to continue higher, since the pullback looked corrective off the 22.30 region. During this past week, I presented you with the set up for the market to rally to an ideal target of 22.85, and, as the close of the week, the market struck a high so far of 22.92.
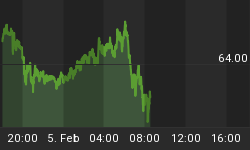
Thus far, the market has been rather predictable, at least within pennies of our targets. But, now we are faced with another test being presented to this market. The question before us, which will likely be decided in the coming week or two, is if the market is going to continue much higher and begin to confirm that the larger degree 3rd wave has begun, or if we will roll over to extend this 2nd wave pullback into early 2018. And, as you can see from the attached 8-minute GDX chart, we now reside within that region of resistance where the market will have to make its decision.
From a targeting standpoint, I want to remind you that the larger degree wave iii should strike a minimal target of 50 in the GDX once we confirm that it has begun. But, remember that the metals complex usually exceeds those standard expectations, as the 50 region is the 1.618 extension of waves i and ii, if wave ii is already completed. In fact, I would much rather target the 58-68 region for just wave iii at this time, assuming wave ii has completed.
But, as noted last weekend, I will need to see it break through the 23.30 region for me to begin to become a believer that the more immediately bullish yellow wave count on the daily chart is the operative count to follow into early 2018. Until such time, I remain quite cautious as we now reside at a resistance point which can turn us down again into early 2018 to extend wave ii.
As you can see, silver also resides within the resistance region we highlighted earlier this week in my mid-week metals update. It will need to see a strong break out through this resistance to open the door to its potential bottoming confirmation. And, lastly, I have attached an 8-minute chart of GLD to outline what I would need to see to be convinced that we have 5 waves off its recent lows. Should that occur, you can see where I have GLD projected in the coming year on its daily chart.
In fact, once the GLD has confirmed it is in the heart of its 3rd wave, it will not take long until it returns to its prior all-time highs. But, again, I must stress how important it is for us to confirm the bottom has been struck before we get too excited about the impending 3rdwave rally. As you can see, there is plenty of room on the upside to garner significant profits during a 3rd wave, but it is of utmost importance to allow the market to confirm its intention before becoming too aggressive on the long side.
Lastly, as you can see from the attached ABX chart, we also reside within that resistance region I have been highlighting for quite some time. So, I cannot say that the ABX is providing us insight beyond that which we have gleaned from the rest of the market.
At this point, I will leave you best wishes for a wonderfully enjoyable holiday season, as we await the next directional cue from the market regarding its intentions for early 2018. You now have the relevant guidelines as to the market’s potential paths, and should anything change, I will certainly send out an update to all our members. Best wishes for a healthy, happy, and profitable 2018.
By Avi Gilburt, ElliottWaveTrader.net


