As symbolized by the 3 Amigos, the macro backdrop is riding on to its destiny. That forward destiny is a top in stocks vs. gold (Amigo 1), a rise in long-term interest rates to potential if not probable limits (Amigo 2) and an end to the yield curve’s flattening trend (Amigo 3).
When our zany friends complete the journey, big changes are likely in the macro markets.
Let’s take a checkup on each Amigo and consider some implications as well.
Amigo 1: Stocks vs. Gold
Using the S&P 500 as an example, stocks/gold ratios are still trending up on the daily time frame.
The big picture allows for higher levels before this Amigo stops riding and the party crashes. Stocks vs. gold is a confidence indicator and confidence is intact and growing. In this case, confidence = mania. This is consistent with our ‘inflation trade’ theme since it is the US stock market that benefited first and most intensely from the Fed’s years of non-stop monetary fire hoses (ZIRP & QEs 1-3 with a side of Op/Twist).
Amigo 2: Long-term Interest Rates
Again sticking with the US for the example, 10yr and now even 30yr yields are gaining more attention out there among market analysts and media. This is 100% on track with our theme that by the time the 10yr hits 2.9% and the 30yr 3.3%, the sound of “BOND BEAR MARKET!!!!” will be deafening.
Here is the bullish 10yr yield. The daily pattern targets 2.9% and…
We have a handy cross reference by the long-term monthly chart. TNX is creeping through potential limiter #1, which is the EMA 110 (solid red line) with the EMA 140 out ahead around 2.9%. I like the target confluence by these two different time frames and views. If the 10yr is to move higher, that would come with ever increasing media noise about the new age of rising yields (and inflation).
Even the 30yr, which as been lagging, has been making a move of late and is in a bottoming pattern similar to the one that the 10yr has broken out of.
But the pattern above has not yet broken out like the 10yr and so, this is either a negative divergence or the 30 is going to play some catch up if it is going to go for its limiter at the monthly EMA 100. The question is, has Bill Gross already made a serious contrary indicator signal or is he going to be anointed the “Bond King” as the 30yr rises to the limiter? See: A Gross Signal Upcoming. His media-bellowed call was incredibly unfortunate in early 2011. Maybe this time he gets to look like a genius temporarily.
Amigo 3: The Yield Curve
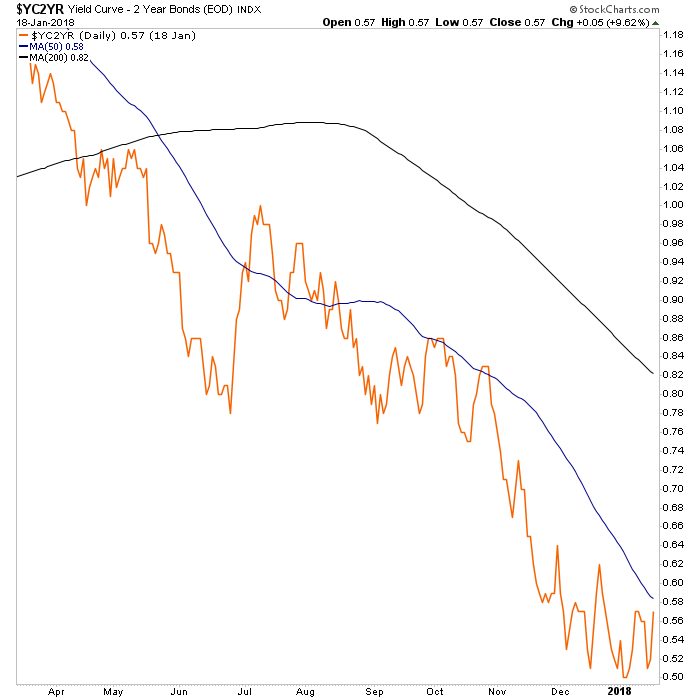
The daily view of the 10yr-2yr is in a downtrend and flattening.
The flattening goes with the macro boom that is taking place. The curve is far from inversion, but contrary to popular belief, it is under no obligation to invert before the macro turns. Then again, a downtrend is a downtrend as long as it is in force… and in force it certainly is.
Bottom Line
Amigo 1 (Stocks vs. Gold): Stocks continue to trend upward vs. gold and this implies ongoing confidence in the boom. The last thing on players’ minds right now is playing defense. Insofar as gold has been strong, which we’d anticipated for this time frame for all the reasons (seasonal, CoT, ‘inflation trade’, etc.) belabored to this point, it’s real bull market will feature an end to the party in the risk ‘on’ stuff. Right now, it’s still party on Garth.
Amigo 2 (Long-Term Interest Rates): The rising interest rates story is gaining traction in the wider media. We have expected long-term yields to rise with the dynamic ending phase of the boom. The noise could become intense and set up a great contrary play as the 10yr and 30yr yields come to their long-term limits (if decades of uninterrupted history as a good guide) and Bill Gross – the Bond King – reclaims his throne.
Amigo 3 (10yr-2yr Yield Curve): It’s simple, it declines with a boom and it rises with a bust. We are in a boom. Risk is high and rising every week, but the trend is the trend for now.
How to play it? I am sticking to a regimen of deploying capital on opportunity, making sure to take ample profits, staying balanced (for example, currently balancing gold sector vs. broad market and favored commodity areas) and always being aware of cash levels.
By Gary Tanashian


