


So far, we have covered the history of Chinese property and equity market growth from before the 2008-2010 global credit crisis till now and have clearly shown that the Chinese property market is rolling over (downward) after the 2016 regulations were put into place to curtail the mass exodus of capital from within China. We have also gone over many of the correlative economic items that point to the fact that a 15~25 percent correction in any one market segment, property, equity, credit/debt or global markets that result in capital risks for China, could drive a contagion effect for the Chinese investors/government. In other words, a simple 10~20 percent price decline in two or more of these markets could put enough pressure on the Chinese that capital reserves could diminish dramatically as well as some level of investor panic could set in to drive a “death spiral” type of event.
Even today, our researchers visited the National Bureau of Statistics in China to continue our research and found the following :
Whereas growth rate of purchases (land), commercial sales and floor space sales and growth rate of fund for development have decreased dramatically just over the past 3+ months. When you look at this data on a year over year context, it shows mild contraction up until December 2017. After December 2017, the contraction in Residential and Commercial real estate activity is dramatic – almost frightening.
Throughout all of 2017, the Growth Rate of Investment in Real Estate Development averaged near 8.1 percent. Beginning in early 2018, this level shot up to 9.9 percent - the highest level in over 13 months.
Growth of Land Area Purchased over the same period showed signs of increase over 2017 – averaging near 11.2 percent or so throughout 2017. The values of this indicator near the end of 2017 were above 15 percent... Whereas the 2018 levels show a -1.2 percent growth rate. In one-month span, the level of this indicator fell -17 percent? Related: The Most Common Market Manipulation Techniques
The Growth Rate of Floor Space and Sales of Commercial Buildings continued to decline throughout most of 2017. Starting near 25~26 percent and ending the year near 10 percent - a -15 percent decrease. What we found very interesting is that Sales of Commercial Buildings increased 1.6 percent in early 2018 while Floor Space sold decreased 3.6 percent. It would appear the Chinese central bank is willing to lend to property buyers while floor space buyers are falling off the map.
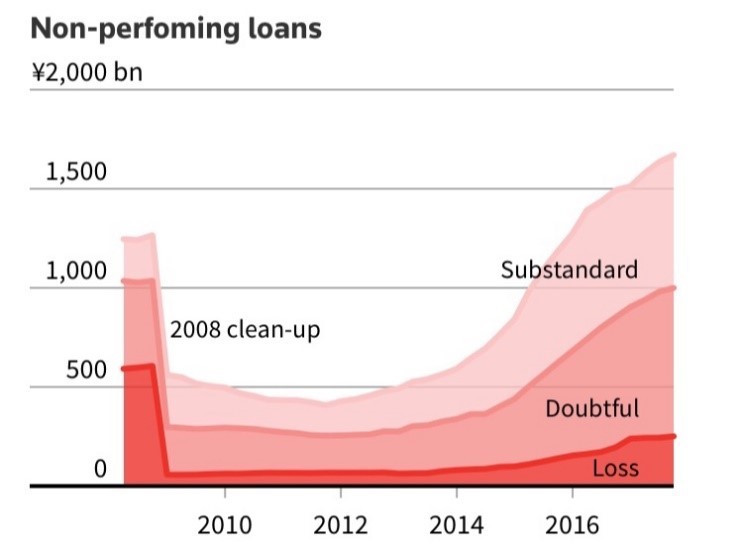
Our primary concern with regards to any type of Chinese or Asian credit market collapse is that the recent 5 to 7+ years of outward capital expansion, expanding investments outside of China/Asia in support of lofty objectives and fuzzy real/return values, may have prompted a massive sub-standard debt issue that could become very dangerous for the world. We've all been reading of the issues of Non-performing assets and loans in China recently. These types of credit/debt are the same types of instruments that led to the 2008~2010 global credit crisis.
(Click to enlarge)
Imagine the Chinese economy as both a local organism (contained to only the China/Asia general region), but also as an international organism (depending on external sources for essential life sustaining components – like the US and UK for purchases and the other emerging markets for growth projects). Now, imagine these external sources experience an extended 10~35 percent general asset decrease over a period of 3~5+ years while the U.S. Federal Reserve, and other central banks, tighten the credit markets and push up borrowing costs. If China is dependent on these outside sources for essential economic sustaining components, then the economic balance they depend upon could become threatened – if not even more fragile than we have already examined.
Yet, consider one additional component of this hypothetical exercise. Consider that the Chinese property and equity markets experience a moderate contraction event (say 10~20+ percent lower over 2~3 years) while the US and other established economies continue to push up the borrowing costs with rising interest rates. We have long believed that capital migrates into the most healthy and opportunistic environments, with ease, and as capital migrates to new sources of returns, it leaves deteriorating economies in a “death spiral” for a period of time. Capital that is unable to quickly move to new opportunistic sources may become trapped in these contracting economies for many years or decades.
Related: Why Crypto Millionaires Are Trading Over Skype
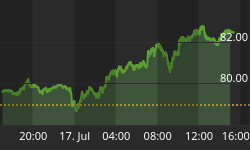
The signs of this hypothetical economic exercise are already starting to become evident. Recent China housing market data shows an incredible decline in activity and pricing – about to fall into negative territory.
(Click to enlarge)
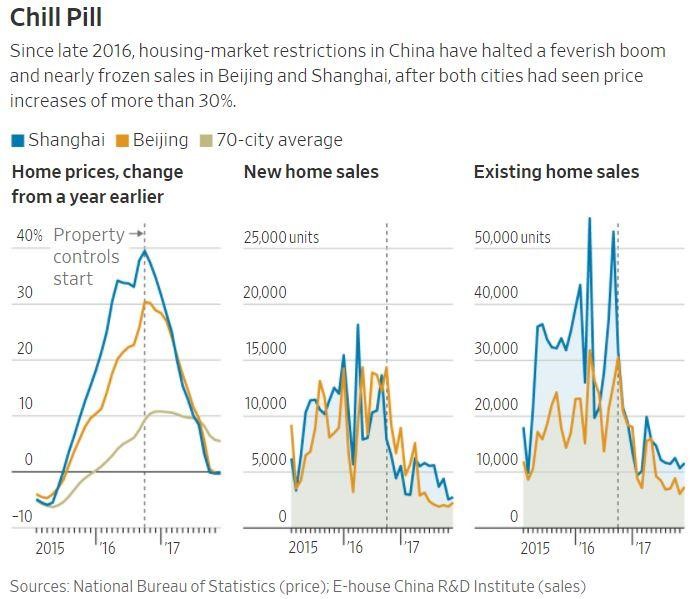
China's property market cycles have topped out as well, indicating a strong potential for further contraction in the real value of property assets.

(Click to enlarge)
Combine this with a global central bank tightening and recently announced U.S./China tariffs and economic positioning and we have the making of another Global Crisis event – this time originating in China/Asia as the Chinese Dragon economy bursts.
(Click to enlarge)
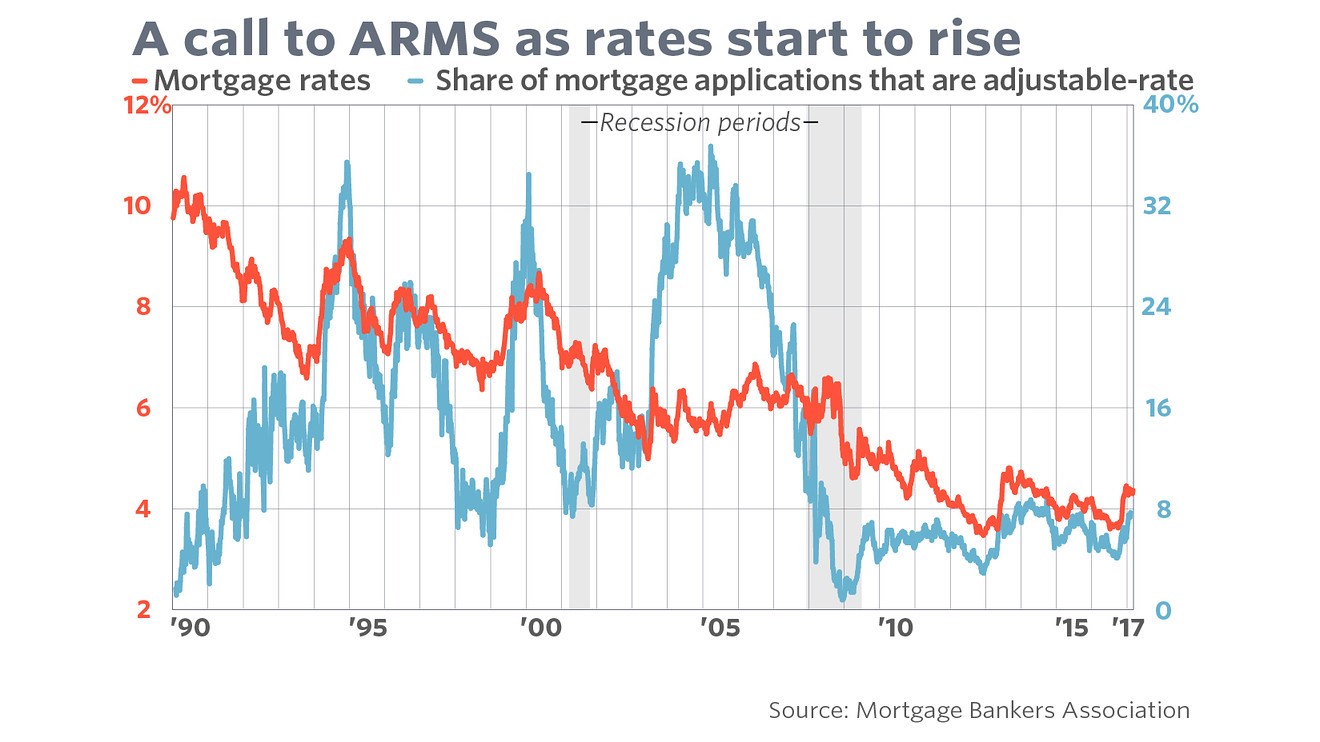
As U.S. mortgage rates continue to climb above 5 percent, the inevitable economic tightening across the US and globe will continue. The attempt to move China away from a U.S. Dollar based economy and become more focused on the Chinese Yuan will, in our opinion, be a difficult transition over many decades. We believe the Chinese/Asian markets are on the cusp of a potentially dramatic collapse and the recent news of US and Chinese tariffs do nothing more than exasperate the current issues. Pay very close attention to the surrounding Asian markets as we continue to watch for breakdown events.
(Click to enlarge)
We have attempted to clearly illustrate our detailed China/Asia market research and the potential for a dramatic price decline in the immediate future. We've outlined how this incredible opportunity for investors was setup, almost perfectly, by the global recovery efforts after the 2008-09 credit crisis. At this point, it would appear the Chinese Dragon economy is on its last leg and we are well positioned to take advantage of the next big move.
By Chris Vermeulen via Technical Traders Ltd.
More Top Reads From Safehaven.com:


Developed by J. Welles Wilder, the Average True Range (ATR) is an indicator that measures volatility. As with most of his indicators, Wilder designed ATR with commodities and daily prices in mind. Commodities are frequently more volatile than stocks. They were are often subject to gaps and limit moves, which occur when a commodity opens up or down its maximum allowed move for the session. A volatility formula based only on the high-low range would fail to capture volatility from gap or limit moves. Wilder created Average True Range to capture this “missing” volatility. It is important to remember that ATR does not provide an indication of price direction, just volatility.
Wilder features ATR in his 1978 book, New Concepts in Technical Trading Systems. This book also includes the Parabolic SAR, RSI and the Directional Movement Concept (ADX). Despite being developed before the computer age, Wilder's indicators have stood the test of time and remain extremely popular.
True Range and forex signals
Wilder started with a concept called True Range (TR), which is defined as the greatest of the following:
Method 1: Current High less the current Low
Method 2: Current High less the previous Close (absolute value)
Method 3: Current Low less the previous Close (absolute value)
Absolute values are used to ensure positive numbers. After all, Wilder was interested in measuring the distance between two points, not the direction. If the current period's high is above the prior period's high and the low is below the prior period's low, then the current period's high-low range will be used as the True Range. This is an outside day that would use Method 1 to calculate the TR. This is pretty straightforward. Methods 2 and 3 are used when there is a gap or an inside day. A gap occurs when the previous close is greater than the current high (signaling a potential gap down or limit move) or the previous close is lower than the current low (forex signals a potential gap up or limit move).
Average True Range (ATR) Conclusions and free forex signals
ATR is not a directional indicator, such as MACD or RSI. Instead, ATR is a unique volatility indicator that reflects the degree of interest or disinterest in a move. Strong moves, in either direction, are often accompanied by large ranges, or large True Ranges. This is especially true at the beginning of a move. Uninspiring moves can be accompanied by relatively narrow ranges. As such, ATR can be used to validate the enthusiasm behind a move or breakout. A bullish free forex signals reversal with an increase in ATR would show strong buying pressure and reinforce the forex signals reversal. A bearish support break with an increase in ATR would show strong selling pressure and reinforce the support break.
free forex signals is Opportunity Trading alerts to trade on a currency pair or gold at Exact entry, exit and stop loss levels
forex signals send via email,SMS and website on https://www.freeforex-signals.com/