There's an old maxim that advises investors to sell their stocks in May and stay away until November. The aphorism originated from the belief that stocks market returns tend to be poorest in the period spanning May-November. The current period in particular is supposed to be a real grind: According to the Stock Trader’s Almanac, May returns tend to be terrible in midterm years as is 2018.
Apparently, though, the stock markets did not get the memo this year.
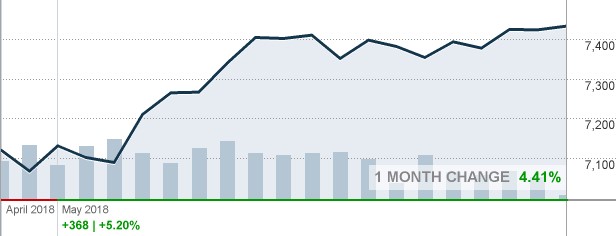
Barring a major upset during the final days of the month, equities are about to post their best May return in nearly a decade. The S&P 500 is boasting a month-to-date return of 2.8 percent; the Dow Jones is up 2.4 percent, while the Nasdaq Composite has clearly outperformed with a 5.3 percent return.
Nasdaq Composite 30-Day Change
(Click to enlarge)
Source: CNN Money
So is the current May simply an outlier that's bucking the trend and has the old four-walled paradigm finally broken?
Actually, neither.
First off, May returns have mostly been a mixed bag with both positive and negative returns. Second, the problem here is that the old wisdom of selling your stocks during summer months is only partly true depending on the stock market and what you do with the cash after selling.
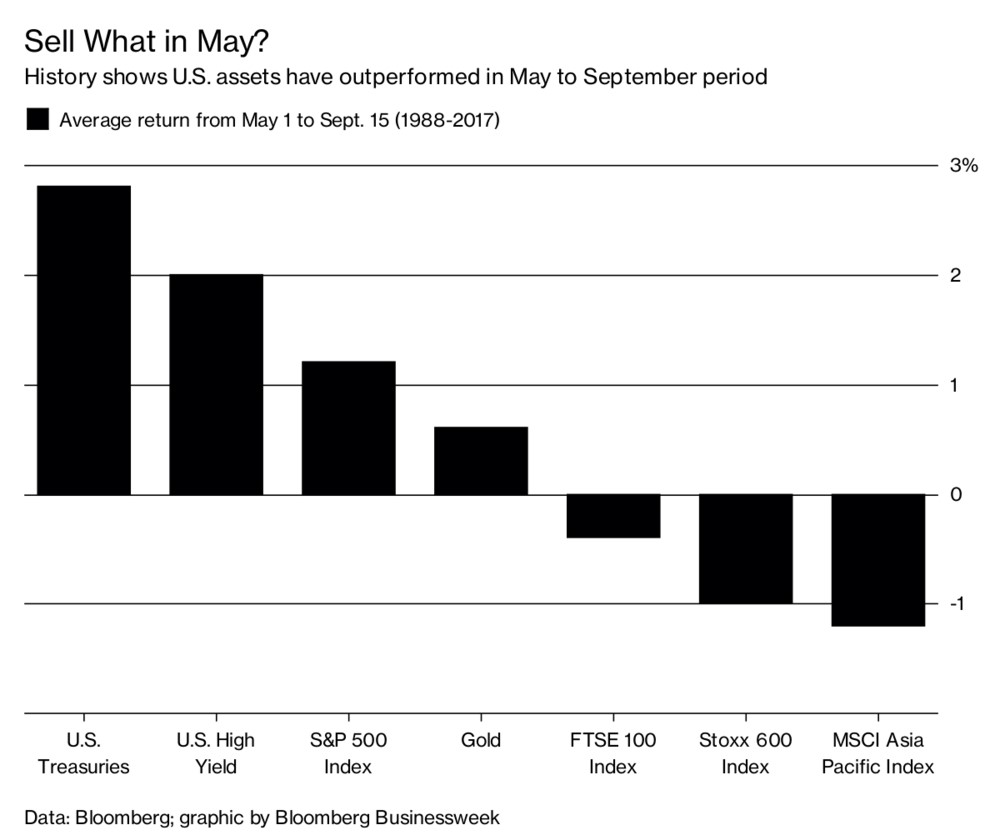
Selling in May might largely be a sound strategy for investors in European and Asian stocks markets. The scenario is, however, more nuanced for investors in American stock markets.
An S&P 500 investor who sold his or her stocks and held the cash during summer and early fall from 1988-2017 clearly followed a bad strategy since the market had a net positive return during that period. An investor, however, who sold in May and put the money in Treasuries and high-yield bonds did better than the market. But these back-and-forth transactions could end up swallowing a sizable chunk of the difference when dealing in small volumes.
(Click to enlarge)
Source: Bloomberg
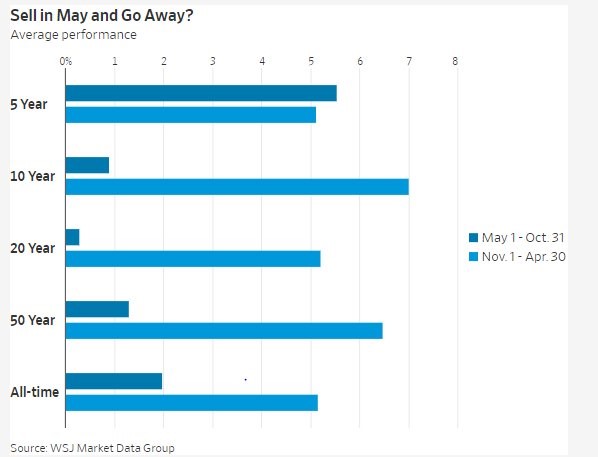
Selling in May has lately become a poor strategy because May 1-Oct 30 has ironically provided better returns than the vaulted Nov 1-Apr 30 period over the past five years.
(Click to enlarge)
Source: MarketWatch
Instead of trying to follow the calendar or an old cliché, it's better to check the direction of the general market as well as chart action for stocks you own. Related: How Goldman Made $200M In A Day
Market's Broken Leg Nearly Healed
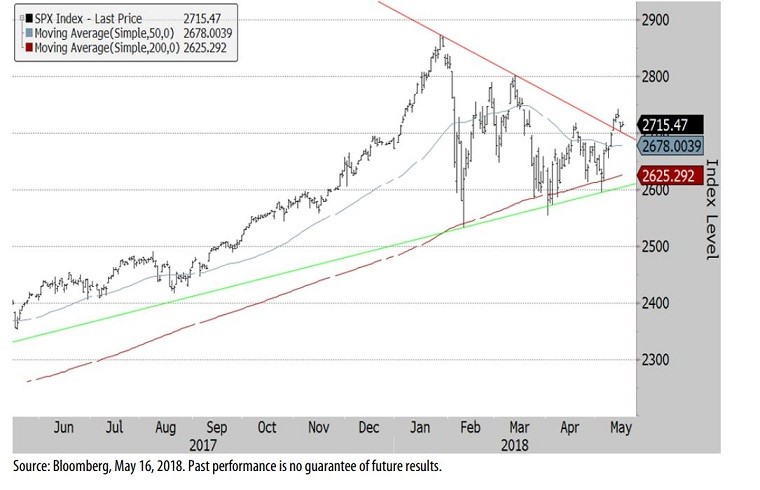
The market has largely operated in a range-bound environment ever since the sharp February correction. Luckily, the broken leg is showing signs of being nearly healed with the S&P 500 and the Dow Jones having managed to pare back some of those losses, while the Nasdaq Composite appears to have fully recovered.
Looking at the long-term charts provides even more encouragement for the bulls.
The S&P has touched and even breached its 200-day moving average numerous times this year. The 200-day moving average is a commonly used proxy to predict a security's long-term trend. In all those times, however, the S&P 500 has closed below its 200-day moving average just once, rebounding above it every other time. This suggests that the level was a support line that is unlikely to be broken unless something dramatic happens in the economic environment.
(Click to enlarge)
Source: MarketWatch
Upcoming events to watch this week include the consumer confidence report, employment report and manufacturing/construction reports.
By Alex Kimani for Safehaven.com
More Top Reads From Safehaven.com:


