


Bitcoin has been denying the bullish ideas of some of the investors for some time now. At the moment, the currency is in a particularly important zone. One specific move out from this area could result in extreme moves, boosting profits on our hypothetical positions.
Bitcoin is still going down. As always, there is an explanation for every move. In an article on CNBC, we read:
The digital currency fell to a low of $6,133.31 as of 1 p.m. ET, according to data from CoinDesk. Bitcoin has lost half its value this year after skyrocketing to almost $20,000 in December.
Prices began stumbling after a study was released by the University of Texas saying at least half of bitcoin's rise last year was due to price manipulation on popular exchange Bitfinex. The 66-page paper said another cryptocurrency called tether was used to buy bitcoin at key moments when it was declining, which helped "stabilize and manipulate" the cryptocurrency's price.
Bitcoin has fallen more than 18 percent in the past week, struggling to regain footing after dropping below $6,700 Sunday.
News of a hack at a relatively small South Korean exchange seemed to have triggered some of the weekend losses, but some traders said selling was also exacerbated by investors hitting "stop losses," selling their bitcoins when they reached a certain price.
We are deeply skeptical of the claim that Bitcoin is going down now because of the publication of the report. Sure, it might, but it doesn’t seem very likely that the investors have had time to process the report and integrate all the information in their process. So, the effect on the price might mostly be due to the news of the paper and fear rather than facts. What effect, though? Related: These Are The Top Gold Producing Countries In The World
Bitcoin was down yesterday but so it was the day before and the biggest daily decline of the last couple of weeks took place on Sunday, days before the report was published. And so far, the action today has been weakly to the upside. There might not be an effect to speak about. If we don’t see more action to the downside in the days to come, this will become likely in our opinion.
Does this mean that we can simply discard the report? No, and we will analyze it in more detail in one of our next alerts. It seems that the implications of the alert are in line with what we’ve been writing for some time now, albeit for different reasons.
Volume Picks up
The action in Bitcoin was pointing in one direction and we have seen an extension of the previous trend. But does this mean that the situation is the same as before?
(Click to enlarge)
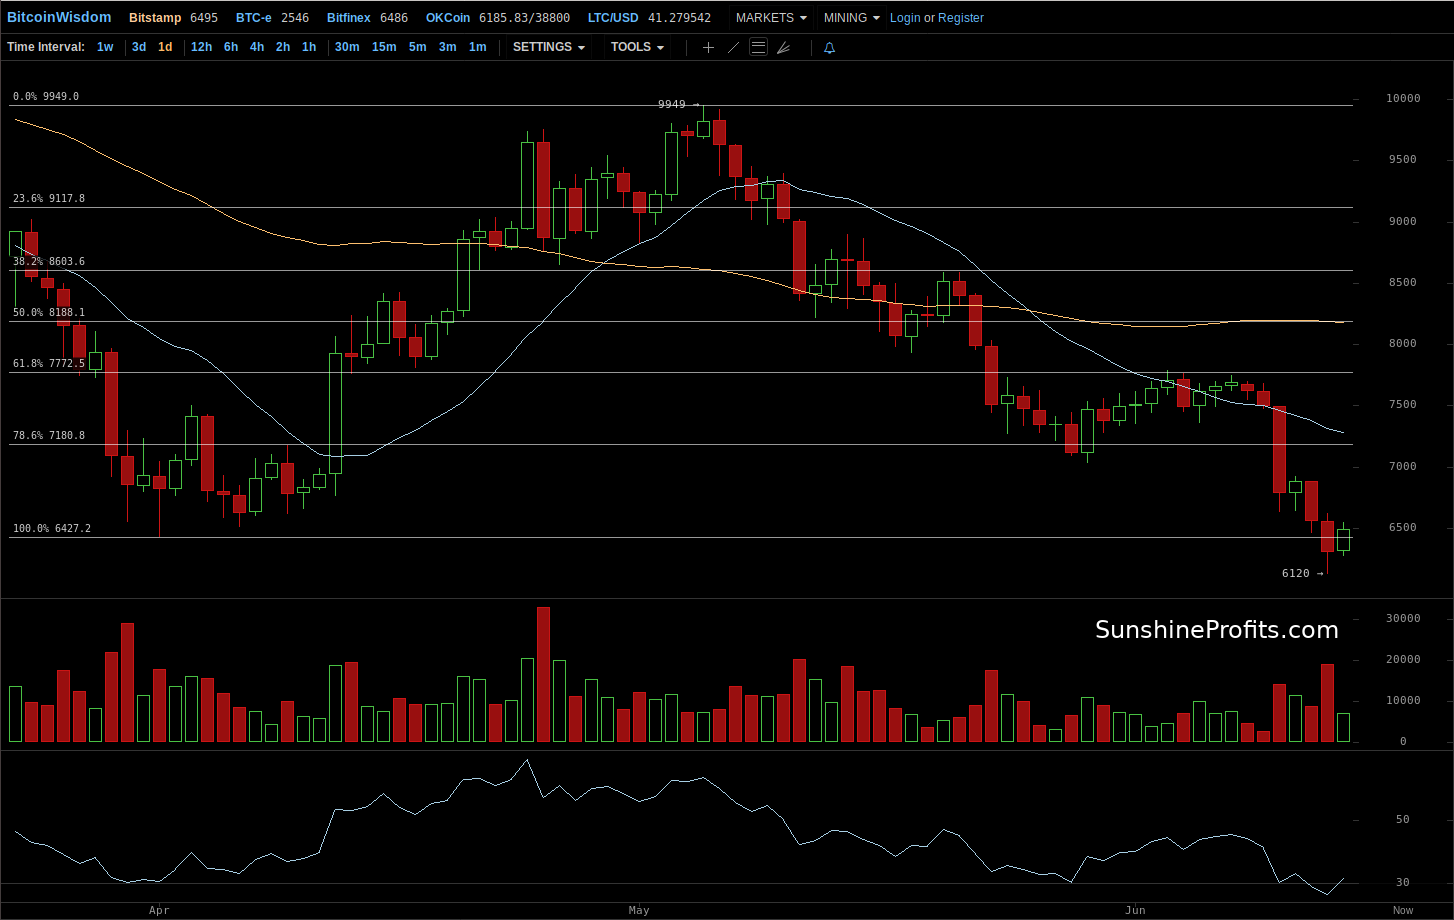
On BitStamp, we saw a continuation of a move down and, actually, an increase in volume compared with the previous very strong day of depreciation we saw on Sunday. Recall what we wrote in our recent comments:
(...) the action we saw yesterday was the most important in days, at least in terms of the daily price moves. But is it really different than what we had seen previously?
Not really. At least, the change in price shouldn’t be a surprise to those who had read our previous alerts. Both the price action and the volume are a confirmation of several points we have been stressing for some time now.
With yesterday’s depreciation, it looks like the move up that started on May 29, 2018 is now firmly denied. Bitcoin bounced off the 78.6% Fibonacci retracement level (second bottom line on the above chart) only to loose steam, stagnate and, finally, react strongly to a negative piece of news with a significant slide below the retracement. This is a bearish sign.
Even a short glance at the above chart reveals that almost all of the move from $6,500 to $10,000 has been erased. As such, the 100% Fibonacci retracement might turn out to be a support level, but a confirmed breakdown below it could also open up the way for more declines. (...)
The one change we see is that Bitcoin pierced the 100% Fibonacci retracement at one moment. This means that the currency has erased all of the previous strong rally. All of the April-May move up is now erased and this possibly means that the rally was actually a counter-trend move. This implication is a bearish one.
Related: Groundbreaking Deal Opens The Mega-Merger Floodgates
At the same time, the RSI is now in oversold territory and this heralded rallies in February and April. It’s definitely not enough to see a tendency, particularly given the fact that we saw (borderline) oversold levels at the end of May and declines still followed. The one implication here might be that we might see a bounce to the upside.

(Click to enlarge)
On the other hand, Bitcoin is dancing around the 100% Fibonacci retracement and if we see a confirmed breakdown below this level, we might see more declines still, and violent ones, so getting out of the market might not be the best idea, in our opinion.
Very Close to Bearish Trigger
Even though the short-term implications are relatively clear, it is always good to take a look at the long-term chart to see how this plays in the longer time horizon.
On the long-term Bitfinex chart, we see that Bitcoin is coming close to a very important support level. In our previous alert, we wrote:
(…) we have a first close in days which is clearly visible from this perspective. This might have important implications going forward. For starters, we might have just seen the beginning of another significant move to the downside.
Another thing is that if you take a look at the long-term declining resistance line based on the all-time high and the early May top (the only declining line in the chart), it looks as though Bitcoin went above the declining like, barely above it, only to come back below it in one day of serious depreciation. Yesterday.
The fact that the currency made a move which looked bullish at first but was not confirmed, and actually denied later on, is a situation where we have a fake breakout followed by an invalidation, and a relatively strong one in terms of the price move. The implications of this pattern are bearish.
Right now, Bitcoin is after a bearish trigger. The next support level is around $6,500 (...). This means that we might see a brief corrective upswing around this level. But it doesn’t seems that betting on the rebound is the thing to do. After all, the currency could go right through this level, paving the way for very substantial declines. And any rebound could be weak. The scenario we take as the most probable outcome at the moment of writing these words is one where Bitcoin pauses or only insignificantly moves up from the $6,500 level before turning South again. This is not automatic and our assessment of the situation can change based on market events. (...)
Bitcoin is now very close to $6,500 – this means that the currency is already at one of the two most important levels at this time. The other level is $6,000 – the February local bottom. If we see a breakdown below this level, Bitcoin could fall off the cliff.
Summing up, we are very close to $6,000, a critical bearish trigger.
By Mike McAra via Sunshines Profits
More Top Reads From Safehaven.com:


